
EUR/USD
Yesterday the EUR/USD dropped into the weekly pivot and finally lurched lower to 1.3720 violating the 50% Fibonacci retracement and is now reacting with some degree of volatility. Presently speaking, the price is punching through the former support, now resistance at 1.3756 which is the weekly pivot point, S1 of the daily pivot point, and also 38% Fibonacci retracement.
The fact that oscillators turned negative is not a motive for so much concern, what's most alarming is the difference between the levels seen just 30 hours ago and now. The price deterioration gives the sellers a reason to explore 1.3700 area.
Resistance: 1.3775; 1.3817; 1.3842; 1.3900
Support: 1.3731; 13709; 1.3684; 1.3642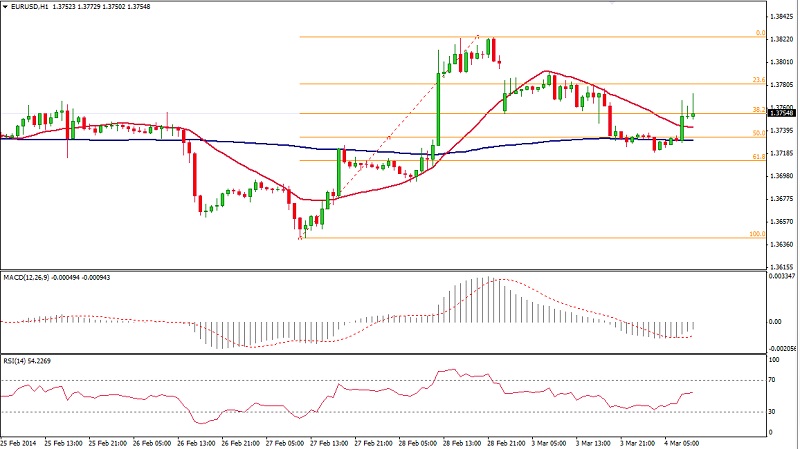 EUR/USD Hour Chart" title="EUR/USD Hour Chart" width="800" height="475">
EUR/JPY
The EUR/JPY is tentatively unwinding yesterday's decline and eked out some moderate gains since the opening around 139.30. Similarly to the EUR/USD, the yen cross shows a penetration of the weekly pivot point at 140.10 with a fast moving quote. On the hourlies, the MACD resurfaced above its center line and the RSI at 63% is also showing nascent signs of a structural brightening. Flows in the EUR/JPY may help to lift the EURUSD during today's trading.
While the 200-SMA as a slight downward trajectory on the 1-hour chart, it couldn't withstand the collision with price action. This is exarcerbating the potential bullishness contained in the price structure.
Resistance: 140.41; 140.77; 141.00; 141.55
Support: 139.86; 139.50; 138.95; 138.59 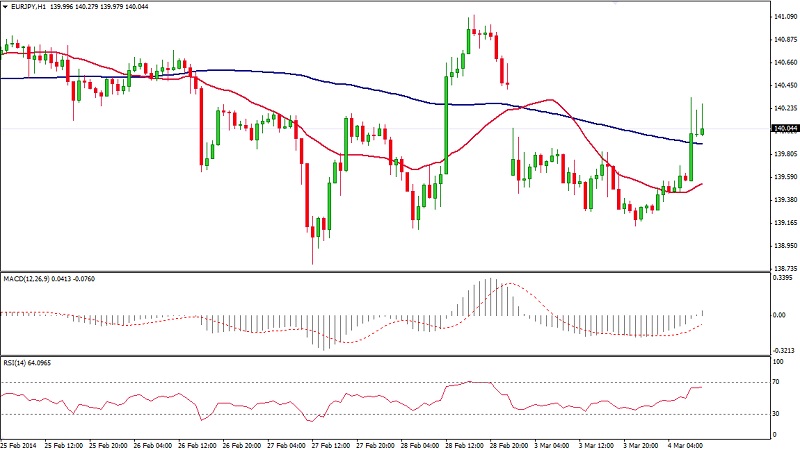 EUR/JPY Hour Chart" title="EUR/JPY Hour Chart" width="800" height="475">
GBP/USD
In lockstep with other majors, the Sterling has seen a migration of the value area to lower levels. At today's open it staged a reactive bounce which is capped below the 200 SMA. We remain suspicious of its current recovery if it continues to trade and hold below the 1.6700 level. The reason is the confluence of several barriers clustered here: the weekly pivot point at 1.6697, the daily pivot at 1.6689 where it is quoting at writing, and the 50% retracement from the swing low at 1.6640.
The RSI repeatedly failed at the lower end of the oscillator range throughout the Asian trading session, to become more constructive on the opening.
The downside remains favored with an overshoot threat to the falling weekly pivot and the mentioned upside barriers.
Resistance: 1.6700; 1.6725; 16787; 1.6823
Support: 1.6628; 1.6692; 1.6530; 1.6500 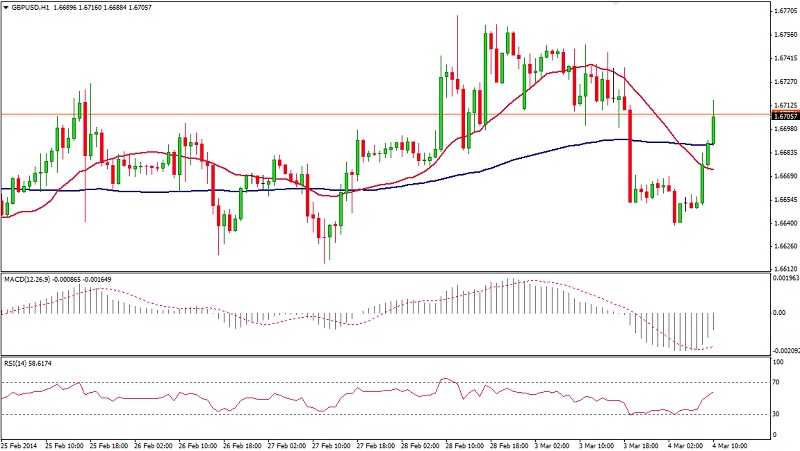 GBP/USD Hour Chart" title="GBP/USD Hour Chart" width="800" height="475">
USD/JPY
After yesterday's session where there haven't been any glaring moves, the cross faces now upside offensive. It still retains its downside vulnerability as long as it holds and trades below the 102.50/80 levels, but today's rally so far did indeed prove enough dollar strength in the short term. Recent price action favors an extension higher with scope of projections at 102.22 and finally at 102.50.
In order to eliminate the possibility of a further bout of strength, a push and hourly close under 101.50 is required, targeting 101.00.
The 200-SMA on the hourlies (101.89) is functioning as resistance at writing. The upper candlestick wicks are an evidence of a degree of supply and the price action seems to stagnate here for the moment.
Failure to remain above 102.00 (weekly pivot point) will warn of a fresh rela
pse towards lower levels in the following sessions.
Resistance: 102.00; 102.13; 102.50; 102.80
Support: 101.65; 101.42; 101.19; 100.96 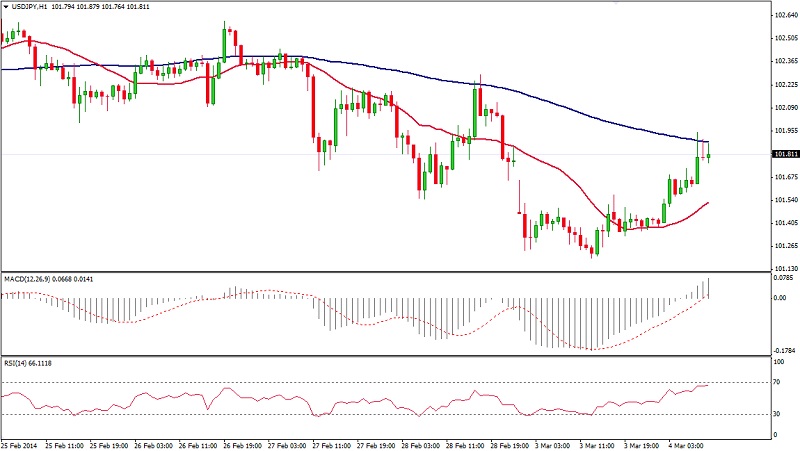 USD/JPY Hour Chart" title="USD/JPY Hour Chart" width="800" height="475">
AUD/USD
While the changeover in the demand/supply balance has been gradual on daily charts, as evidenced by the rounded top in formation, the intraday picture is quite different. Erratic movements and growing price instability has been the tone for the Australian dollar in recent trade. This whipsaw type of activity occasionally develops from an intermediate correction on higher time horizons.
Underpinning any advance we can find the weekly pivot point (0.8960) and the 200-SMA (0.8969) on the 1-hour chart. At the downside, in turn, the path is less obstructed with supports less clustered. The daily pivot which has been defended today so well could be considered the sentiment hinge for the present session. If the bears can eradicate this level with a bit of force a potential recapture of the previous swing low around 0.8900 cannot be ruled out.
Resistance: 0.8944; 0.8970; 0.9000; 0.9017
Support: 0.8900; 0.8870; 0.8825; 0.8750 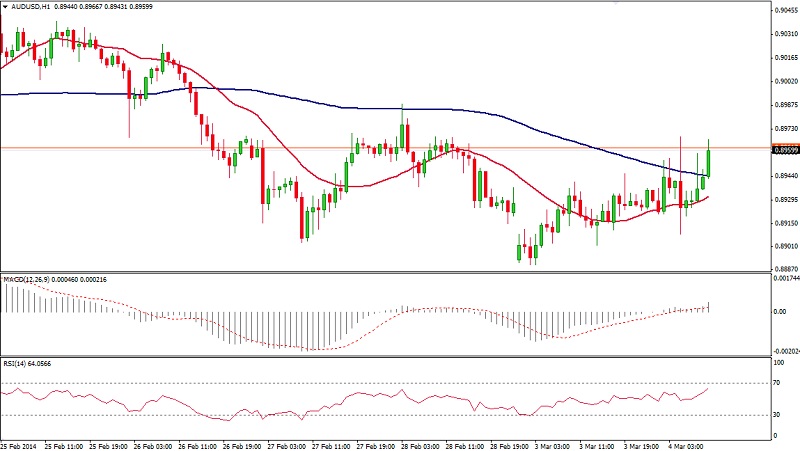 AUD/USD Hour Chart" title="AUD/USD Hour Chart" width="800" height="475">
AUD/NZD
Some dissipation of the strong downside momentum seen in yesterday's trading is causing the Pacific cross to experience a trading range environment. It has retraced 38.2% of the nosediving action, piercing the weekly poivot (1.0706) on one occasion and tentatively forcing shorts to cover above this level. The cross is being priced around the round figure 1.0700 at the moment after having accelerated from the daily pivot at 1.0655.
The oscillators are printing in positive territory albeit close to their center values. The 200-SMA (1.0692) is expected to offer some resistance. Only an hourly close above it would open the scope for higher resistances.
Resistance: 1.0706; 1.0737; 1.0760; 1.0780
Support: 1.0650; 1.0636; 1.0604; 1.0585 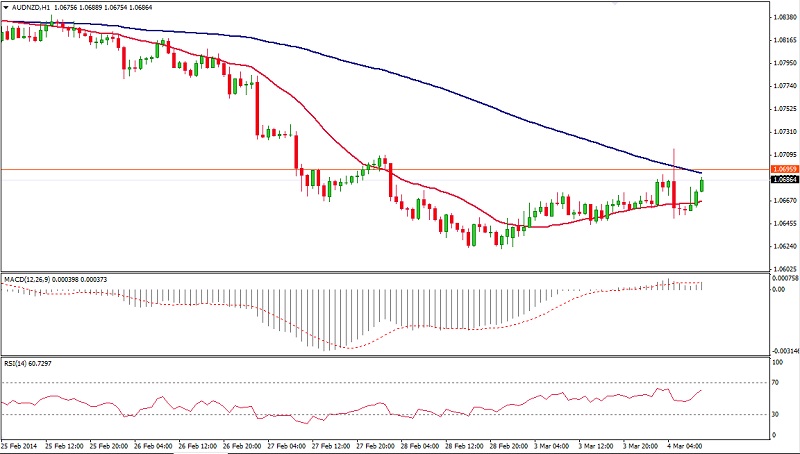 AUD/NZD Hour Chart" title="AUD/NZD Hour Chart" width="800" height="475">
XAU/USD
Having cracked down sharply in the recent hourly candles, gold is undoubtedly becoming an eye catcher today. The rise to fresh new highs yesterday proved to be relatively short-lived, and the metal threatens now to depreciate further towards the start of the rally at 1325. Though presently hesitating, its short term bias remains lower. There is little support on the way down to 1330 where the weekly pivot is set and also currently the 200-SMA.
Price has a tendency to move proportionately and so is the present base forming happening at a 50% retracement from the recent rally. Bulls may fuel the expectation that this market will stall out shy of a full retracement and reverse in the opposite direction, while bears seem to have set shop at 1350.
Adding credence to the bull's view is the current RSI holding the 40% levels which should be seen as the oversold barrier on an uptrending market.
Resistance: 1345; 1350; 1355; 1361
Support: 1335; 1329; 1320; 1311 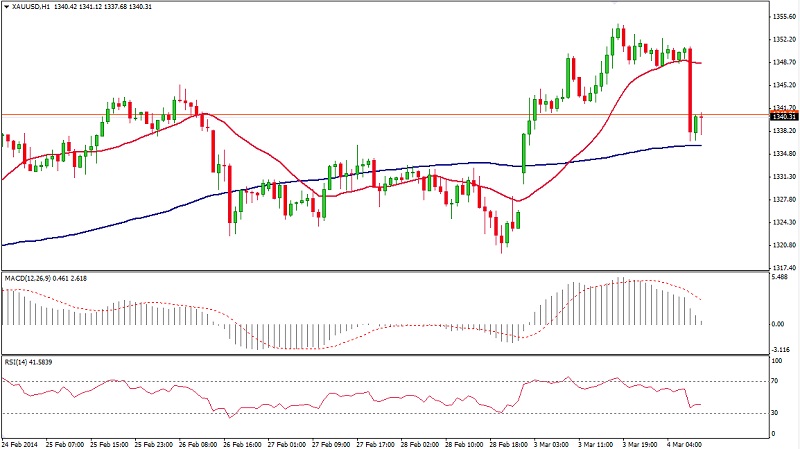 XAU/USD Hour Chart" title="XAU/USD Hour Chart" width="800" height="475">