EUR/USD
The euro fell to 1.3750 zone, ending the week in red and erased all gains of last week, following false break above 1.39 Resistanceistance zone and upside rejection on approach to 1.40 barrier. Loss of 1.38, round-figure / trendline Supportport and 1.3780, previous range floor, significantly weakened near-term structure and increased risk of double-top formation, in case of further weakness that requiResistance loss of 1.3720, daily cloud base and 1.3670, 04 Apr higher low, to be confirmed. Bears may be delayed for corrective action, as near-term studies are oversold, with initial Resistanceistance at psychological 1.38 barrier, also near former range floor and 1.3840 lower top / near Fibonacci 38.2% retracement of 1.3992/1.3744 descend. Any stronger rallies should be capped under 1.39, previous strong Resistanceistance, to keep bears in play.
Resistance: 1.3800; 1.3840; 1.3868; 1.3900
Support: 1.3744; 1.3720; 1.3700, 1.3670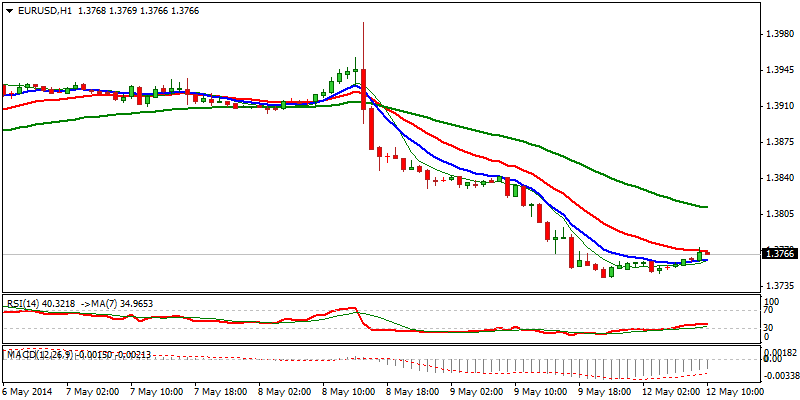
EUR/JPY
The pair lost traction and dipped through initial 141 Supportport, on last Friday’s weakness, after repeated failure to sustain gains above 142 barrier and left triple-top at 142.40 zone. FResistanceh weakness dented very strong 140 Supportport, two-month range floor, seeing threat of deeper pullback on sustained break below 140 level. Near –term studies are negative, however, oversold conditions suggest break and possible near-term basing attempt, before fResistanceh attempt lower, as daily indicators are establishing in the negative zone. Corrective attempt through 140 handle to face strong Resistanceistance at 140.80 lower top / Fibonacci 38.2% retracement of 142.35/139.87 fall, along with previous Supportport at 141 zone, where rallies should be ideally capped.
Resistance: 140.46; 141.00; 141.15; 141.40
Support: 139.87; 139.10; 138.77; 138.00 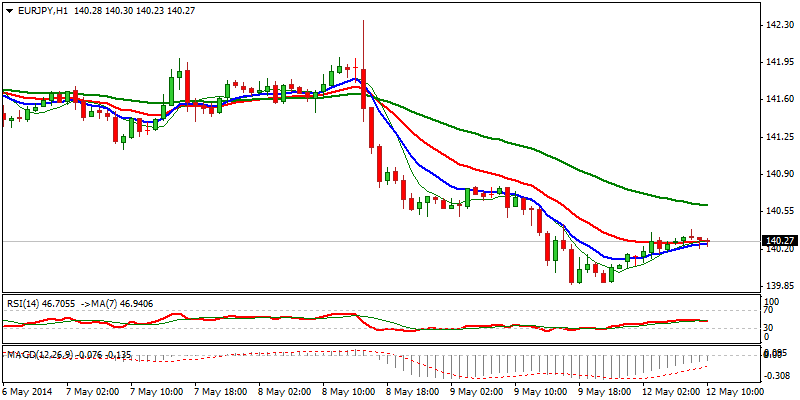
GBP/USD
Cable stalled on approach to psychological 1.7000 barrier and pulled back to 1.6830 zone, triggering daily and weekly close in red and signaling possible stronger pullback in larger bull-trend. Reversal was so far contained by daily 20SMA and just above previous peaks, keeping overall bulls so far intact and marking current easing a technical pullback, before fResistanceh attempts higher. On the other side, negative near-term studies and daily indicators in descending mode from overbought territory, keep the downside risk in play. Confirmation of negative scenario, however, requiResistance clear break below higher platform at 1.6760 zone, to confirm. Otherwise, the upside targets will remain in near-term focus, with regain of 1.69 handle, required to confirm bulls back in play.
Resistance: 1.6900; 1.6918; 1.6973; 1.6995
Support: 1.6800; 1.6760; 1.6730; 1.6700 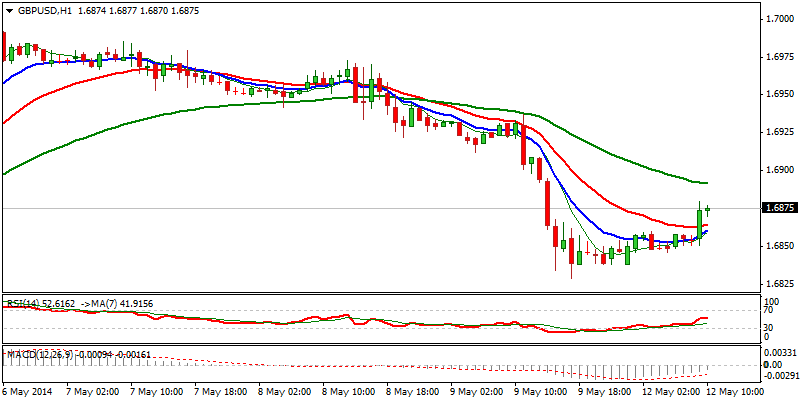
USD/JPY
The pair closed below 102 barrier, marking weekly close in negative tone, with daily indicators in negative zone, maintaining downside risk on the larger picture. On the other side, lower timeframes studies hold neutral stance, after near-term price action stabilized above 101.20, short-term base, averting immediate risk of violation of strong 101.20 / 100.74 Supportport, in favor of extended consolidation. Gains so far hold below 102 Resistanceistance, keeping sideways mode in play, despite improved hourly studies. Only sustained break above 102 barrier and lower top at 102.18, to signal double-bottom formation and fResistanceh recovery attempt.
Resistance: 102.00; 102.18; 102.40; 102.78
Support: 101.42; 101.31; 101.20; 101.00 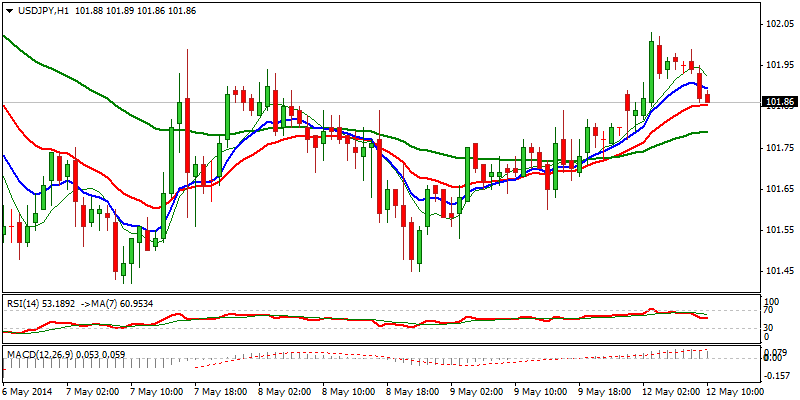
AUD/USD
The Aussie holds positive near-term tone against the greenback, as bounce from 0.92 base retraced nearly 76.4% of the pullback from 0.9460 to 0.9204. Daily cup-and-holder pattern is nearly completed, with clear break above 0.9380 required to confirm and open way for final push towards key 0.9460 barrier, 10 Apr high. The overall picture remains bullish, as near-term price action is underpinned by double bull-cross at 0.9150 zone; 20/200 and 55/200SMA’s. Break above 0.9460 top to confirm bullish Resistanceumption and open psychological 0.95 barrier next. Conversely, break below trendline Supportport 0.9300 to delay, while only loss of 0.92 handle will be bearish
Resistance: 0.9377; 0.9393; 0.9424; 0.9460
Support: 0.9346; 0.9317; 0.9300; 0.9250 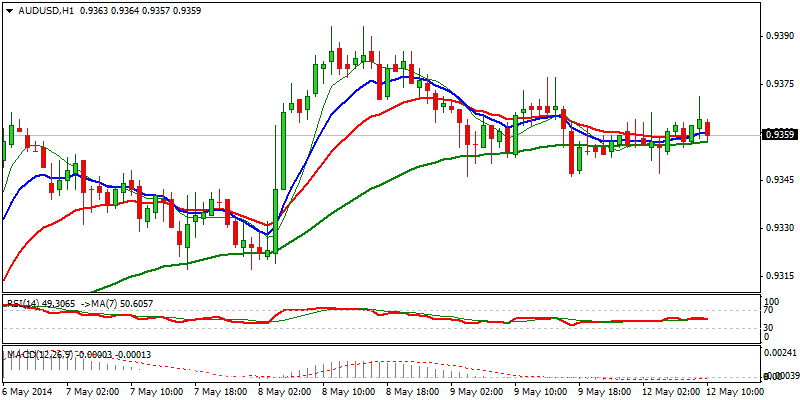
AUD/NZD
The pair maintains positive near-term tone, as reversal off 1.0644, 06 May low, formed Morning Doji Star reversal pattern and the price bounced close to key near-term Resistanceistances at 1.09 zone. However, larger picture shows short-term price action still moving within the range, although, trading close the range ceiling levels. Clear break above 1.0900/40 barriers is required to establish fResistanceh direction and signal major reversal as well as base formation at 1.05 zone. Otherwise, failure here would signal prolonged sideways trading in the short-term. Extension below 1.08 handle to confirm a pause in near tem rally and open way for further retracement of 1.0644/1.0867 ascend.
Resistance: 1.0867; 1.0907; 1.0950; 1.1000
Support: 1.0814; 1.0782; 1.0756; 1.0729 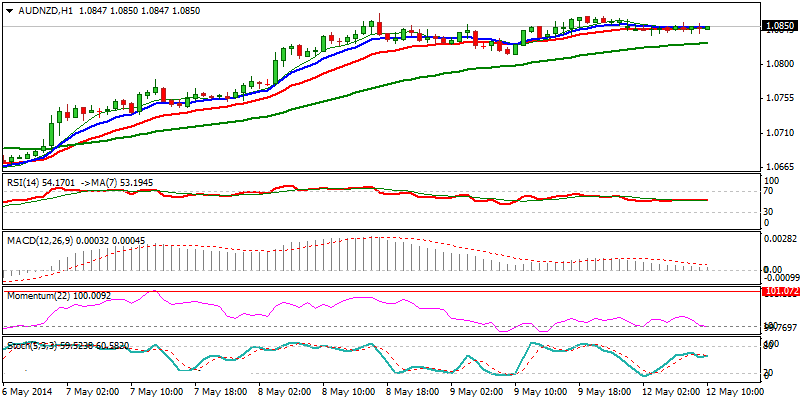
XAU/USD
Spot Gold remains in near-term sideways mode, with overall tone being negatively aligned and keeping the downside vulnerable, as the weekly closure occurred below the first breakpoint at 1300. Near-term indecision is confirmed by double-Doji candle, suggesting further consolidation before fResistanceh leg lower., with 1300 as initial barrier, reinforced by 20/200 SMA’s death cross and lower top at 1315, expected to cap, ahead of fResistanceh attempt lower. Break below fResistanceh low at 1277, to open next Supportports at 1273/68. FResistanceh gains above 1315 barrier to delay bears, however, regain of key near-term barrier and recent range top at 1330, is required to neutralize bears and signal stronger recovery.
Resistance: 1300; 1306; 1315; 1330
Support: 1277; 1273; 1268; 1262 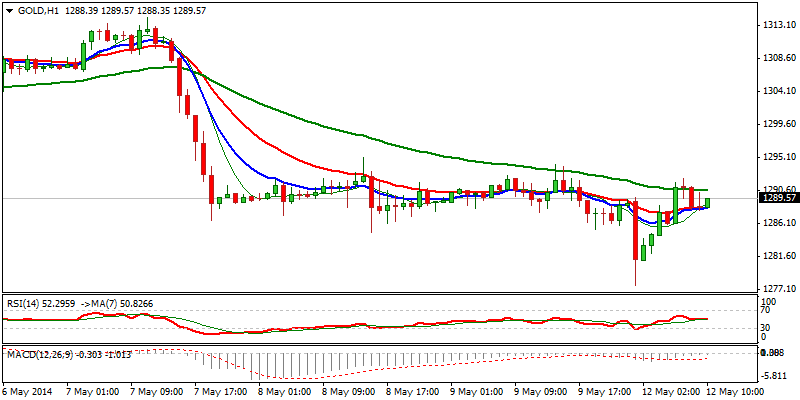
- English (UK)
- English (India)
- English (Canada)
- English (Australia)
- English (South Africa)
- English (Philippines)
- English (Nigeria)
- Deutsch
- Español (España)
- Español (México)
- Français
- Italiano
- Nederlands
- Português (Portugal)
- Polski
- Português (Brasil)
- Русский
- Türkçe
- العربية
- Ελληνικά
- Svenska
- Suomi
- עברית
- 日本語
- 한국어
- 简体中文
- 繁體中文
- Bahasa Indonesia
- Bahasa Melayu
- ไทย
- Tiếng Việt
- हिंदी
Market Outlook: EUR/JPY Pair Lost Traction
Published 05/12/2014, 06:07 AM
Updated 02/21/2017, 08:25 AM
Market Outlook: EUR/JPY Pair Lost Traction
Latest comments
Loading next article…
Install Our App
Risk Disclosure: Trading in financial instruments and/or cryptocurrencies involves high risks including the risk of losing some, or all, of your investment amount, and may not be suitable for all investors. Prices of cryptocurrencies are extremely volatile and may be affected by external factors such as financial, regulatory or political events. Trading on margin increases the financial risks.
Before deciding to trade in financial instrument or cryptocurrencies you should be fully informed of the risks and costs associated with trading the financial markets, carefully consider your investment objectives, level of experience, and risk appetite, and seek professional advice where needed.
Fusion Media would like to remind you that the data contained in this website is not necessarily real-time nor accurate. The data and prices on the website are not necessarily provided by any market or exchange, but may be provided by market makers, and so prices may not be accurate and may differ from the actual price at any given market, meaning prices are indicative and not appropriate for trading purposes. Fusion Media and any provider of the data contained in this website will not accept liability for any loss or damage as a result of your trading, or your reliance on the information contained within this website.
It is prohibited to use, store, reproduce, display, modify, transmit or distribute the data contained in this website without the explicit prior written permission of Fusion Media and/or the data provider. All intellectual property rights are reserved by the providers and/or the exchange providing the data contained in this website.
Fusion Media may be compensated by the advertisers that appear on the website, based on your interaction with the advertisements or advertisers.
© 2007-2024 - Fusion Media Limited. All Rights Reserved.
