
Theeuro holds positive sentiment and bounced off 1.3840 higher base, to test levels close to fresh high at 1.3965, posted on 13 Mar. Near-term price action moves in triangular consolidation, after recovery rally stalled at 1.3946 yesterday. Triangle support lies at 1.3910, also Fibonacci 38.2% retracement of 1.3844/1.3946 ascend, ahead of higher base at 1.3880, also 61.8% retracement, above which stronger pullbacks should find ground to keep near-term positive tone in play. Fresh attempt through 1.3965 opens short-term target and psychological barrier at 1.4000 and 1.4056, Fibonacci 138.2% expansion of the wave from 1.3642, in extension. Conversely, slide below 1.3880 would delay bulls and risk retest of near-term base at 1.3840 zone and daily channel support at 1.3800.
Resistance: 1.3946; 1.3965; 1.4000; 1.4056
Support: 1.3910; 1.3880; 1.3840; 1.3800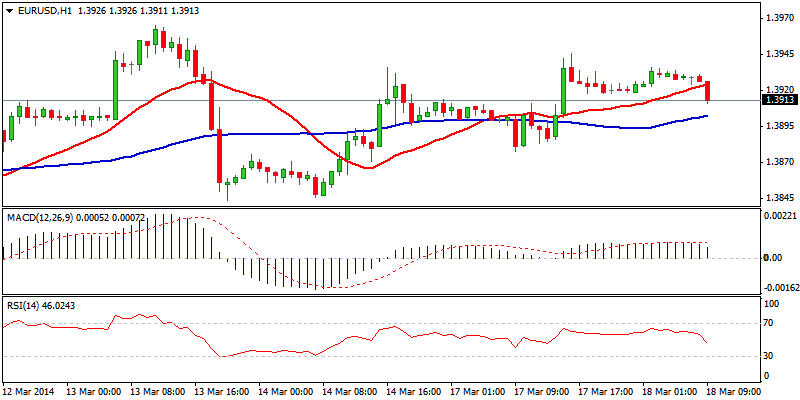 EUR/USD Hour Chart" title="EUR/USD Hour Chart" width="800" height="400">
EUR/JPY
Near-term price action moves in corrective mode after last week’s upside rejection at 143.78 was followed by acceleration lower that found temporary support at 140.43, bull-trendline off 136.21 low. Fresh weakness retraced over 61.8% of 138.77/143.78 upleg and approached psychological 140.00 support. Hourly technicals improved on current bounce, however, weak tone on 4-hour chart studies, keeps the downside at risk, as corrective rally stalled near psychological 142 barrier. Extension below initial support at 141.00, daily cloud top, to risk return to 140.43 and test of psychological 140.00 support in extension. Only bounce through 142 barrier would sideline downside risk and open way for stronger correction.
Resistance: 142.00; 142.23; 142.63; 143.00
Support: 141.00; 140.79; 140.43; 140.00 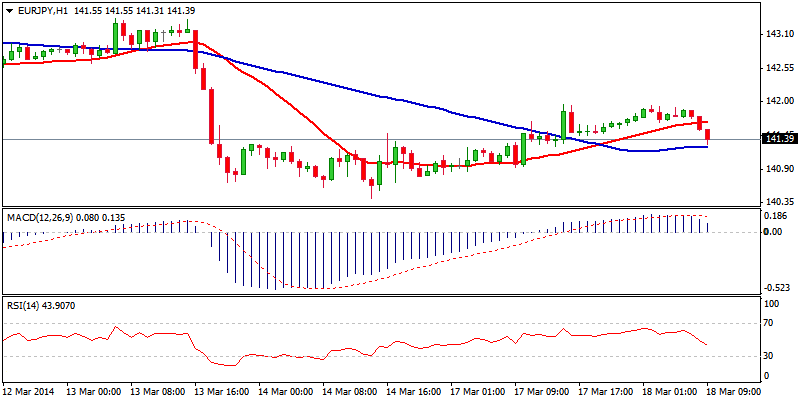 EUR/JPY Hour Chart" title="EUR/JPY Hour Chart" width="800" height="400">
GBP/USD
Cable remains in near-term sideways mode, with price action attempting at the range’s lower boundary, as recovery attempts were capped at 1.6664, keeping immediate barriers at 1.6700/16 intact for now. Near-term studies are negatively aligned, with fresh acceleration lower, attempting below psychological 1.66 handle. Immediate focus lies at lowered range floor at 1.6566, below which to open 1.6536, 50% retracement and psychological 1.6500 support in extension and signal stronger correction of larger upleg from 1.5853 to 1.6821. Otherwise, holding above 1.6566, would signal extended sideways trading and only regain of pivotal 1.6716 barrier, to improve the structure and shift focus higher.
Resistance: 1.6664; 1.6700; 1.6716; 1.6740
Support: 1.6566; 1.6536; 1.6500; 1.6451 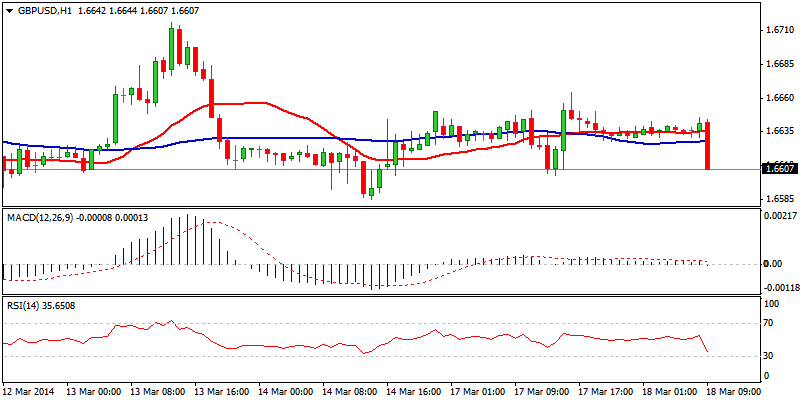 GBP/USD Hour Chart" title="GBP/USD Hour Chart" width="800" height="400">
USD/JPY
Near-term price action moves in a consolidative mode above fresh low at 101.19, after the pair fully retraced 101.19/103.75 upleg. Hourly studies turned positive, as the price approached psychological 102 barrier, where gains were capped by 4-hour 20SMA for now. On the other side, negative 4-hour studies see the action limited. Ideally, rallies should be capped under 102.50, midpoint of 103.75/101.20 descend, to keep bears intact. Break below 101.19 handle is required to open another significant support at 100.74, 03/05 Feb base and psychological 100 support in extension. Only break above 102.50 and 102.80, Fibonacci 61.8% retracement of 103.75/101.19 would improve near-term structure.
Resistance: 101.93; 102.17; 102.50; 102.80
Support: 101.50; 101.20; 101.00; 100.74 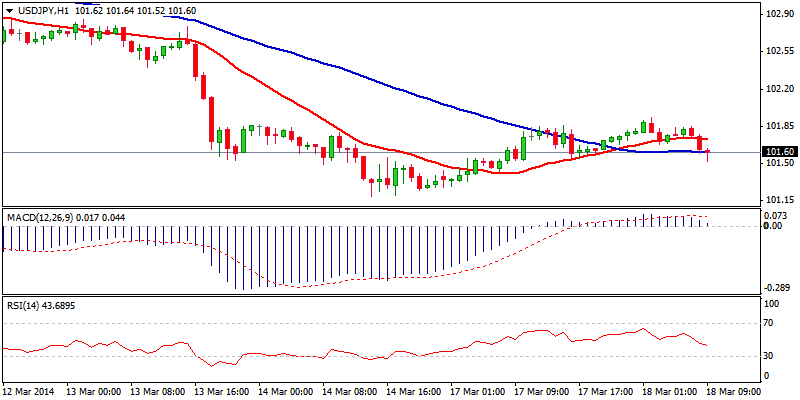 USD/JPY Hour Chart" title="USD/JPY Hour Chart" width="800" height="400">
The pair trades in a choppy mode, with near-term structure being positive, as the price stabilizes above near-term base at 0.9000, reinforced by daily 20SMA / Tenkan-sen / Kijun-sen bull cross. Fresh bounce cracked psychological 0.9100 barrier in attempt at pivotal 0.9132 resistance, break of which to resume recovery rally from 0.8658, 24 Jan low, which is interrupted by current consolidation. Clearance of 0.9132 opens 0.9165, 10 Dec 2013 high and 0.9206, 50% retracement of larger 0.9755/0.8658 descend. Initial support lies at 0.9060, hourly 55SMA, while only loss of 0.9000 base would increase downside pressure and signal double-top formation.
Resistance: 0.9108; 0.9132; 0.9165; 0.9206
Support: 0.9060; 0.9000; 0.8923; 0.8900 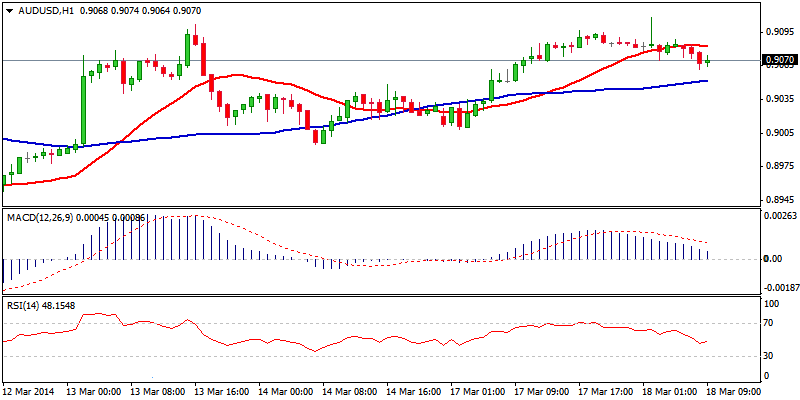 AUD/USD Hour Chart" title="AUD/USD Hour Chart" width="800" height="400">
AUD/NZD
The cross trades in extended consolidative phase off fresh low at 1.0534, posted last week. Improvement in hourly chart studies is supportive for the near-term price action as the price cracks 1.0600 barrier, approaching 1.0618, Fibonacci 38.2% of the downleg from 1.0755 to 1.0534. Also, 4-hour indicators moving above their midlines, support the notion. Clear break above 1.0620 zone, previous low / Fibonacci 38.2% resistance, is seen as minimum requirement to confirm near-term base and allow for stronger bounce towards psychological 1.0700 barrier and pivotal 1.0755, 07 Mar lower top. However, caution is required as daily structure remains negative and favors further downside and full retracement of 1.0488/1.0942 upleg, with current action seen as corrective and preceding fresh move lower. Only sustained break above 1.0755 would sideline bears.
Resistance: 1.0620; 1.0650; 1.0670; 1.0700
Support: 1.0575; 1.0534; 1.0500; 1.0488 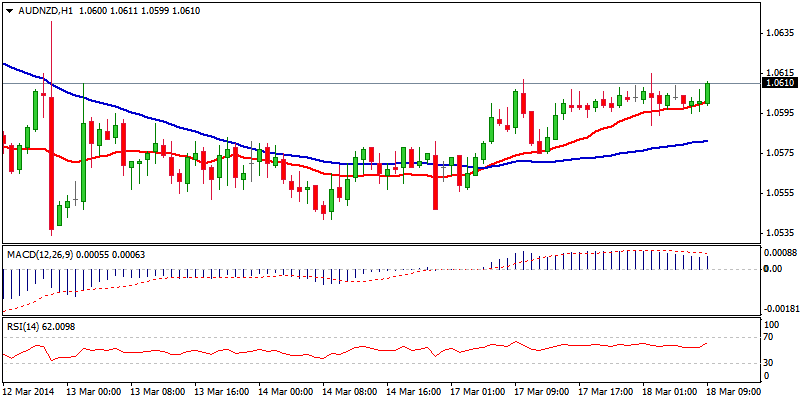 AUD/NZD Hour Chart" title="AUD/NZD Hour Chart" width="800" height="400">
XAU/USD
Spot Gold enters corrective phase after losing important support at 1364, higher platform and Fibonacci 38.2% retracement of 1319/1392 upleg, with fresh acceleration lower sidelining near-term bulls. As hourly studies turned negative, more downside risk could be expected. Next support levels lay at 1353, previous peaks of 03/06 Mar and 1347, Fibonacci 61.8% retracement, with price action finding temporary footstep at 1357, 4-hour 55SMA. Hourly conditions are oversold that suggests consolidative action, however, downside pressure is expected to remain, as 4-hour indicators are entering negative territory. Break below 1347 to open 1336 and more significant 1327 higher platform. Overall bulls remain in play, as larger picture outlook favors further upside and eventual test of psychological 1400 target, with fresh action higher to be delayed by current correction.
Resistance: 1367; 1374; 1382; 1392
Support: 1357; 1353; 1347; 1336 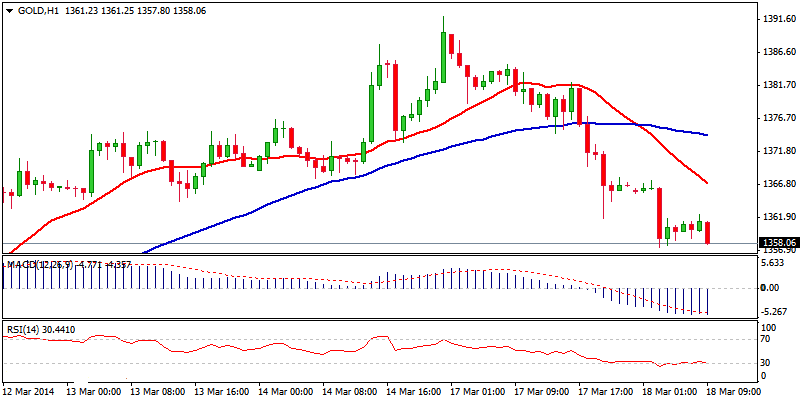 XAU/USD Hour Chart" title="XAU/USD Hour Chart" width="800" height="400">