Monitoring purposes SPX; Sold 9/30/14 at 1972.29= gain .003%; Long SPX on 9/25/14 at 1965.99.
Monitoring purposes Gold: Gold ETF (SPDR Gold Trust (ARCA:GLD) long at 173.59 on 9/21/11.
Long Term Trend monitor purposes: Flat

Timers Digest recorded the Ord Oracle # 10 in performance for one year time frame updated October 6.
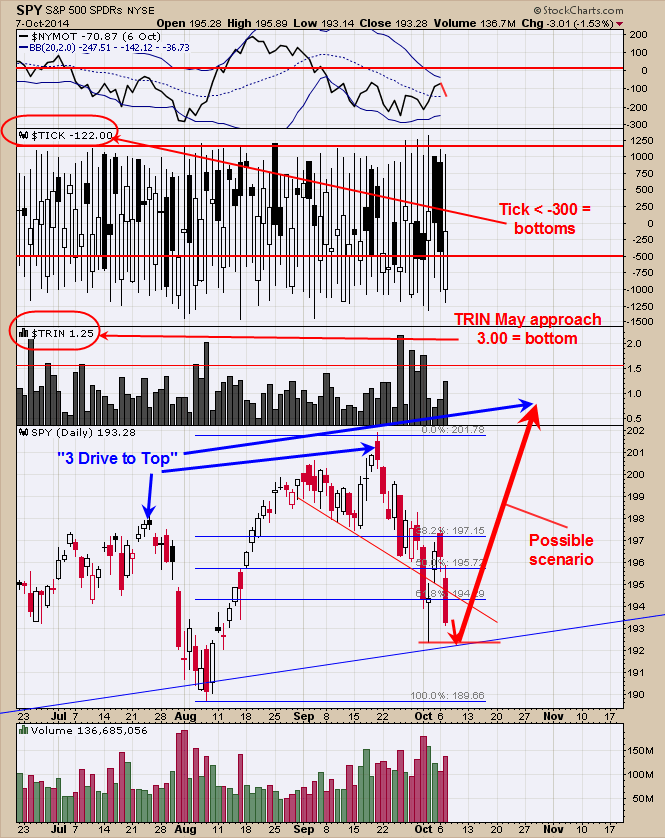
We are still expecting a bottom to form this week to early next week. As we said before most market bottoms form in panic and the best indicators we found that define panic is the TRIN and Ticks. Today the TRIN closed at 1.25 and not in the panic range. A reading near 3.00 or higher would suggests panic and that a bottom in the market is near. Also the tick closes < -300 also suggest panic and something we are watching for. Again this is the week before option expiration week and a week to be careful in. The pattern that appears to be forming is a “Three Drives to Top” and the bottom off of the second top is near. We are still expecting new highs on the next rally once the next low is found. Staying neutral for now.

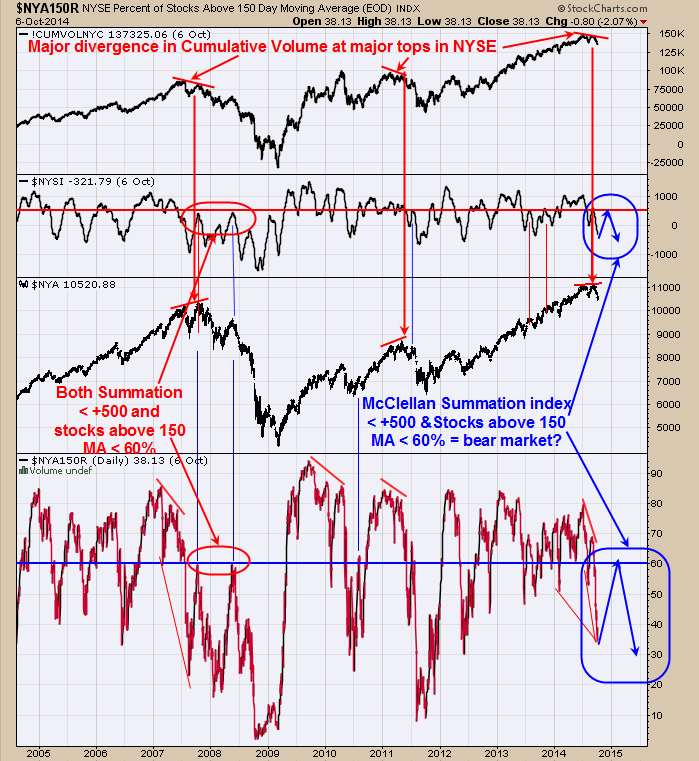
We have updated this chart from a couple of weeks ago and it worth to keep this chart in focus. The top chart is the Cumulative volume for the NYSE. It has been a bearish sign for the market when this indicator makes lower highs as NYA makes higher highs (pointed out in red arrows). Note that his indicator is showing a major divergence. The second window from the top is the McClellan Summation index. It has been a bearish sign for the market when the Summation index turns down near +500 (last top came at +586 and may be close enough). The middle window is the NYSE percent of stocks above its 150 day moving average. It has been a bearish sign for the market when this indicator turned down near 60%. It has been rare when both the Summation index turns down below +500 range and the percent of stocks in the NYSE above 150 day moving average fall below 60% near the same time but when they have it has marked major declines. On this chart this condition appeared at the 2007 top and once again in 2008. The next rally in the market is important in that both the percent of stocks below 150 day MA’s is below 60% and Summation index is below +500. The next rally needs to push both the Summation index above +600 and the Percent of stocks above 150 MA to above 60% and that happens than the bullish trend in stocks most likely will continue (noted in blue). However on the next rally, the Summation index stalls near +500 or below and the percent of stocks above 150 MA fails to get above 60% than market could be heading for trouble. The Feds quantitative easing program is scheduled to end in November and will take away a lot of liquidity. We will be watching how the next rally unfolds.

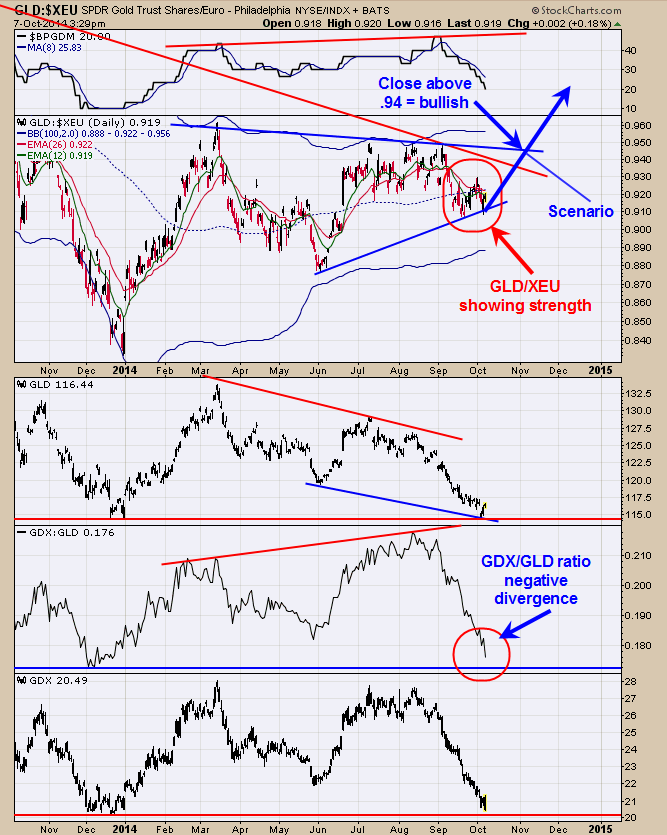
The GLD/XEU ratio may be drawing a bullish Head and Shoulders bottom on a large scale where the Head is the January 2014 low. To confirm this pattern a “Sign of Strength” is needed through the Neckline (.94 range) which has not happen yet but this ratio is moving towards that level. If a break above .94 does occur with a “Sign of Strength” it would have a target to near 1.17 level. If the break does materialize that would be bullish for gold stocks and Gold/$. The negative for short term is the GDX/GLD ratio turned down and a short term bearish sign for both gold and gold stocks. Market could be setting up for a capitulation short term where a bottom could form for longer term. Still neutral for now.
