Get 40% Off
👀 👁 🧿 All eyes on Biogen, up +4,56% after posting earnings. Our AI picked it in March 2024.
Which stocks will surge next?
Unlock AI-picked Stocks

Market Analysis: TRIN In Bear Hold; Gold Starting An Impulse Wave

Published 04/21/2021, 09:24 AM
Updated 07/09/2023, 06:31 AM
  • SPX Monitoring purposes; Sold long SPX 4/9/21 at 4128.80= gain 6.16%; Long SPX on 3/24/21 at 3889.14.
  • Monitoring purposes GOLD: Long GDX on 10/9/20 at 40.78.
  • Long Term SPX monitor purposes; Sold long SPX on 1/15/21 at 3768.25= gain 10.80%; Long SPX on
    10/26/20 at 3400.97.
  • ARMS Index Chart

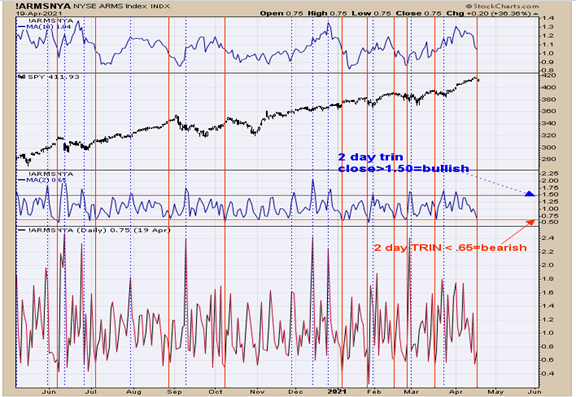
    The bottom window is the closing TRIN readings and the next window up is the 2 day TRIN close. The two day TRIN close above 1.50 shows panic (dotted blue lines) in the market and a short term bullish sign; below .65 (red lines) show a complacent market and a bearish sign.

    Yesterday the 2 day TRIN closed at .65.  To get back to a bullish picture the TRIN would need to show panic with readings above 1.50 for a couple of days. Today’s TRIN close came in at 1.14 and not at panic levels suggests short term consolidation is not done. There is an open gap near 400 on the SPY which is a possible target. Staying neural for now.
    SPY Daily Chart

    We've updated this chart from yesterday, when we said:

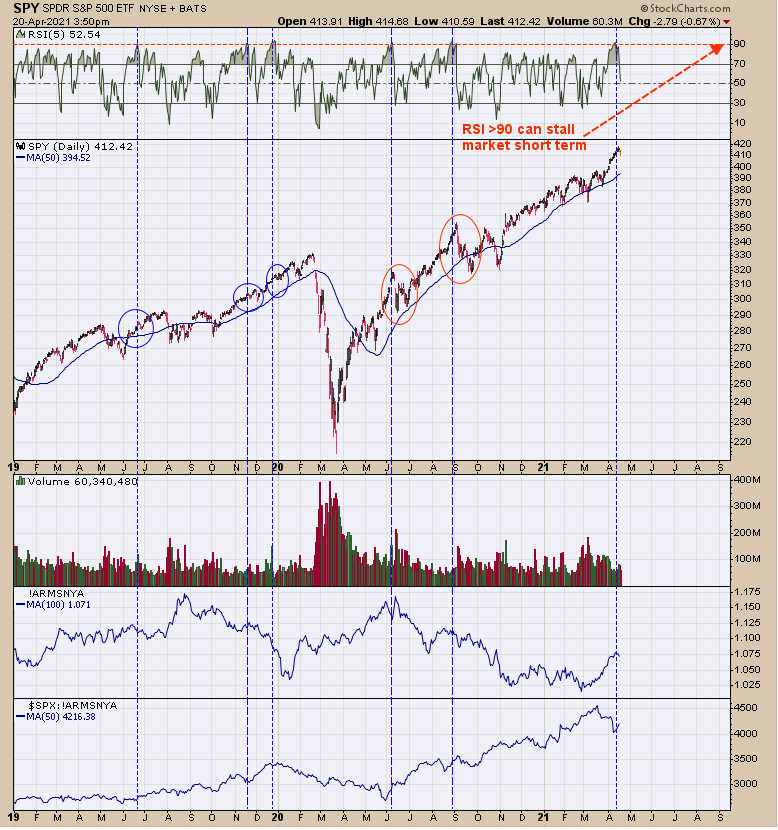
    “Last Tuesday the 5 period RSI for the SPY hit 92. Previous readings on an RSI (5) above 90 have lead to short term consolidation and that could be happening here. Bigger trend remains bullish but a sideways consolidation is possible short term. Watching the TRIN and Tick for panic readings to suggest market is near the next low.” The consolidation appears to have started. Staying patient for now."  
    NDX-Gold Bugs Index Daily Chart

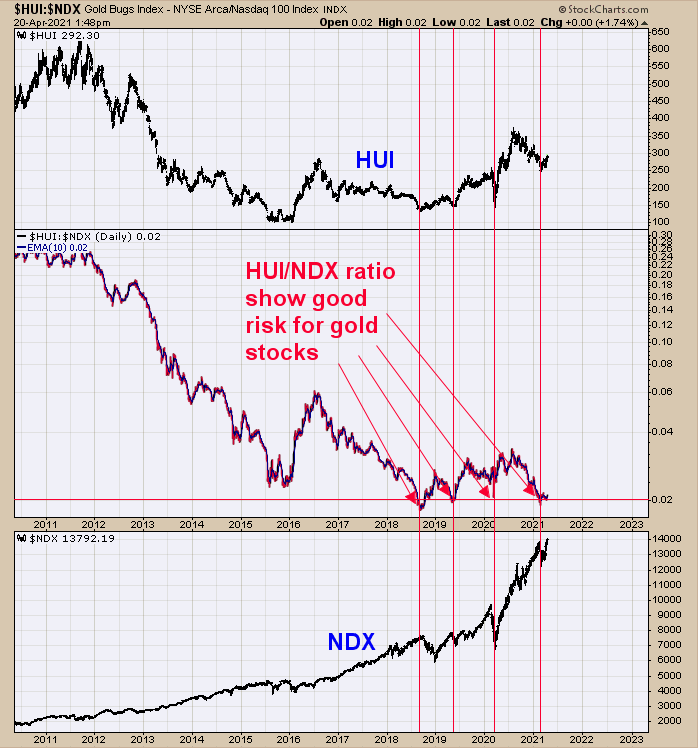
    The above chart is of the daily HUI/NDX ratio going back to 2011. When this ratio rises, it's an indication that HUI is outperforming NDX. When it's falling, then the opposite is true—NDX is outperforming HUI. 

    Right now this ratio has returned to an area previously visited. There is a lot of evidence that the gold index is starting an impulse wave. As far as investments go, this may indicate that the coming weeks and/or maybe months, could have the HUI index outperforming the NDX index.

    We also noticed that several of our gold stock positions have the weekly Bollinger Bands® (BB) pinching.  When the BB starts to spread, the energy will be released, and as such, the impulse rally may have started. We are long GDX (10/9/20 at 40.78).


3rd party Ad. Not an offer or recommendation by Investing.com. See disclosure here or remove ads .

Latest comments

Risk Disclosure: Trading in financial instruments and/or cryptocurrencies involves high risks including the risk of losing some, or all, of your investment amount, and may not be suitable for all investors. Prices of cryptocurrencies are extremely volatile and may be affected by external factors such as financial, regulatory or political events. Trading on margin increases the financial risks.
Before deciding to trade in financial instrument or cryptocurrencies you should be fully informed of the risks and costs associated with trading the financial markets, carefully consider your investment objectives, level of experience, and risk appetite, and seek professional advice where needed.
Fusion Media would like to remind you that the data contained in this website is not necessarily real-time nor accurate. The data and prices on the website are not necessarily provided by any market or exchange, but may be provided by market makers, and so prices may not be accurate and may differ from the actual price at any given market, meaning prices are indicative and not appropriate for trading purposes. Fusion Media and any provider of the data contained in this website will not accept liability for any loss or damage as a result of your trading, or your reliance on the information contained within this website.
It is prohibited to use, store, reproduce, display, modify, transmit or distribute the data contained in this website without the explicit prior written permission of Fusion Media and/or the data provider. All intellectual property rights are reserved by the providers and/or the exchange providing the data contained in this website.
Fusion Media may be compensated by the advertisers that appear on the website, based on your interaction with the advertisements or advertisers.
© 2007-2024 - Fusion Media Limited. All Rights Reserved.