Get 40% Off
🤯 Perficient is up a mind-blowing 53%. Our ProPicks AI saw the buying opportunity in March.Read full update

Market Action Suggests Downside In Precious Metals

Published 10/15/2019, 04:10 AM
Updated 07/09/2023, 06:31 AM

At present, there could be a number of positive developments for precious metals.

Last Friday, the US dollar cracked lower and could be at risk of lower levels into year-end.

Days earlier the Federal Reserve announced new “QE-like” measures just as they told us it was not really QE.

In addition, the market is showing a nearly 68% chance of a rate cut later this month.

Isn’t all this bullish for precious metals? Shouldn’t precious metals be challenging recent highs on this news, rather than fading?

The market is a discounting mechanism. It anticipates and discounts news and fundamental developments in advance.

QE is not necessarily bullish for precious metals unless it directly leads to inflation through increased government spending or helicopter drops.

Dollar weakness should help precious metals but it hasn’t been the primary driving force lately.

Fed policy and rate cuts are the primary driver for precious metals and the market already anticipated these rate cuts over the summer. The potential October rate cut is largely priced in and the market now could be discounting a pause in rate cuts into 2020.

This interpretation aligns with the technicals.

Gold has been battling around $1500/oz but cracked last Friday. It was its first weekly close below $1500 for the first time since July.

Gold has initial support at $1420 to $1425 with strong support at $1370 and $1400.
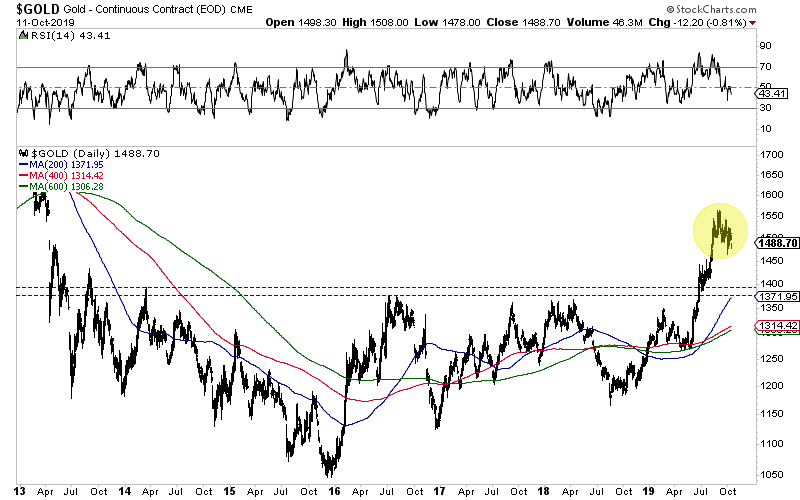
Gold Daily Chart

Last week the oversold rally in the miner ETFs (GDX, GDXJ, SIL) peaked and reversed course at 50-day moving averages. The miners remain in a short-term downtrend and still have room to fall to their 200-day moving averages.

3rd party Ad. Not an offer or recommendation by Investing.com. See disclosure here or remove ads .

GDX closed just below $27.00. It has a confluence of strong support at $24-$25.
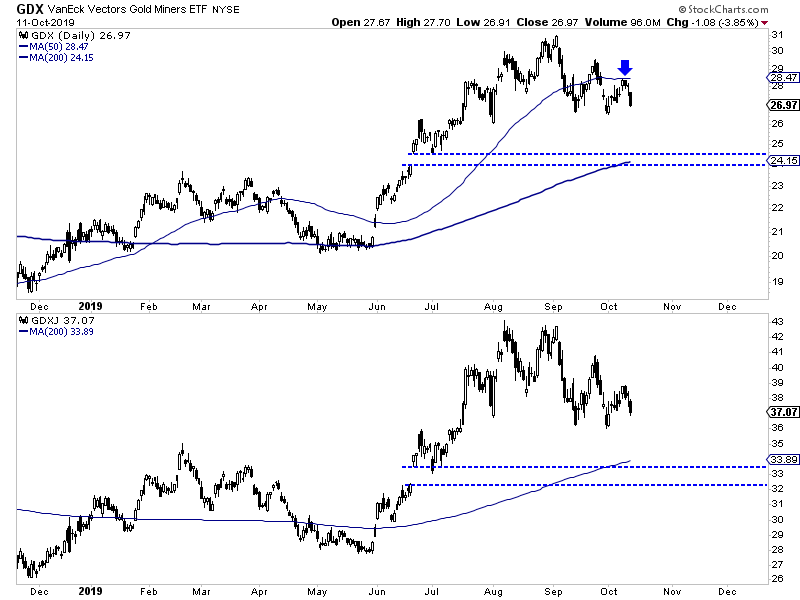
GDX Daily Chart

GDXJ closed just above $37.00. It has a confluence of strong support at $33-$34.

The precious metals sector has not reacted positively to potential favorable developments and the technicals continue to argue for lower prices. As bulls we need to respect this near-term outlook rather than fight it.

In the meantime, wait for Gold and gold stocks to get more oversold and approach the key support levels. Better value and new opportunities will continue to emerge.

Use this time to tweak your portfolio and err on the side of buying quality at a discount.

Latest comments

I remember you aaying the same when gold was at 1250 , u said 600 is coming. Gold was ovr bought from lsst 6 months that y little correction was nencessary fo 60-70$ and u again thinking. Look at the world economy, geographical conditions, us recession, etc... gold is still bull higher and your will say th same when gold crosss 1600-1800 and fee dollat drops from correction. Dont show yourself a timex watch in digital age.
Risk Disclosure: Trading in financial instruments and/or cryptocurrencies involves high risks including the risk of losing some, or all, of your investment amount, and may not be suitable for all investors. Prices of cryptocurrencies are extremely volatile and may be affected by external factors such as financial, regulatory or political events. Trading on margin increases the financial risks.
Before deciding to trade in financial instrument or cryptocurrencies you should be fully informed of the risks and costs associated with trading the financial markets, carefully consider your investment objectives, level of experience, and risk appetite, and seek professional advice where needed.
Fusion Media would like to remind you that the data contained in this website is not necessarily real-time nor accurate. The data and prices on the website are not necessarily provided by any market or exchange, but may be provided by market makers, and so prices may not be accurate and may differ from the actual price at any given market, meaning prices are indicative and not appropriate for trading purposes. Fusion Media and any provider of the data contained in this website will not accept liability for any loss or damage as a result of your trading, or your reliance on the information contained within this website.
It is prohibited to use, store, reproduce, display, modify, transmit or distribute the data contained in this website without the explicit prior written permission of Fusion Media and/or the data provider. All intellectual property rights are reserved by the providers and/or the exchange providing the data contained in this website.
Fusion Media may be compensated by the advertisers that appear on the website, based on your interaction with the advertisements or advertisers.
© 2007-2024 - Fusion Media Limited. All Rights Reserved.