Leading Indicators
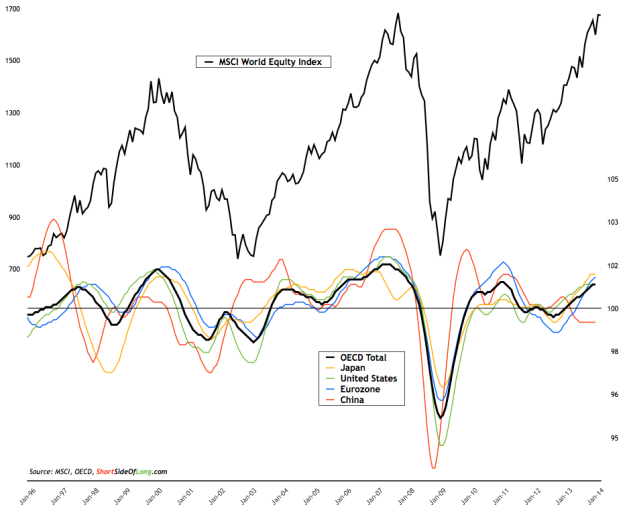
Chart 1: Global leading indicators continue to show DM improvement
OECD Leading Indicators data is very much similar to last month, with slow and progressive overall global improvement. According to OECD’s interim economic assessment “recovery is under way in the world’s advanced economies, underpinned by supportive financial conditions and reduced drag from budgetary tightening, but activity in the major emerging markets is mixed.” The chart above shows OECD Total LEI upswing has most likely already been discounted by the super strong rise in global equity index since November 2012. On the other hand the slowdown in China, together with some other EM economies, is better seen when one looks at the industrial commodity price correction. Note: investors should remember that even though OECD prides itself to be a “leading indicator”, the stock market does a great job of anticipating changes in economic activity well before LEIs (OECD LEI vs Stock Performance chart).
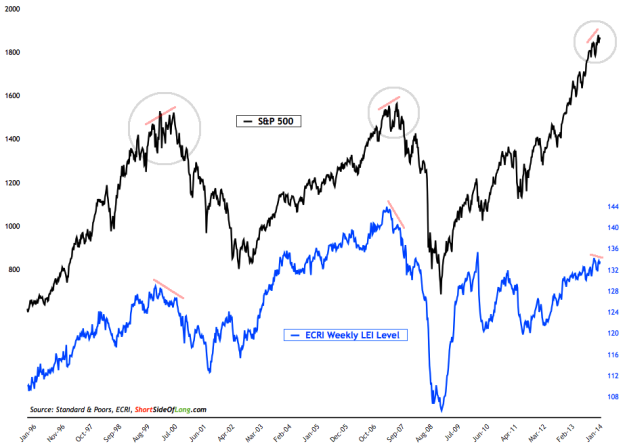
Chart 2: Weekly ECRI index is setting up a bearish divergence with S&P
ECRI Weekly Leading Indicator has been rising in tandem with the US equity markets index, however in recent weeks the new highs by the broad market have not been confirm by various leading indicators within the ECRI Weekly Index. The recent index readings came in at 133.5, but have not been above to exceed 134.2 from early January of this year. A bearish divergence similar to 2000 and 2007, perhaps? We will know in due time. Annualised Growth Index is currently at 2.9%, compared to readings over 4% seen in January 2014 (chart from last month here). Note: ECRI LEI’s are designed to forecast U.S. economic activity, but majority of the time also correlate closely to the stock market and the credit spreads.
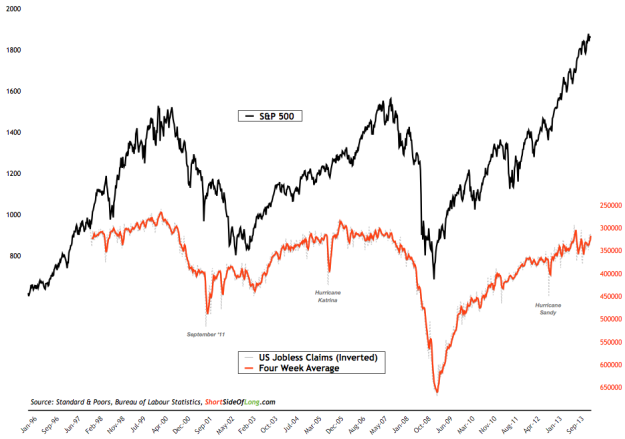
Chart 3: US jobless claims have not made progress since September ’13
US Weekly Jobless Claims, averaged over four weeks, improved slightly throughout the month of March. The 4 week moving average currently stands at 317,750, but over the last two quarters we have not made much progress. As already stated last month, it seem that we find ourselves in the later stages of the business cycle, similar to late 1990s and mid 2000s, where the vertical rise in stock prices occurs without a huge improvement in employment conditions. Has the recovery reached its full potential for the cycle? When equities rise, without an economic improvement, that is usually a signal that the expansion has been discounted and speculation is taking place (last phase of the bull market). Note: As a forward looking indicator, US weekly jobless claims anticipate the lagging economic data of non farm payrolls, and therefore hold a much closer correlation to the stock market performance.
G3 Business Confidence
In the February report, we focused on the G3 consumer sentiment. Today, we take step back from the demand side conditions and re-focus towards supply side. We are looking at business conditions and CEO sentiment in the US, Germany and Japan (the three pillars of developed markets).
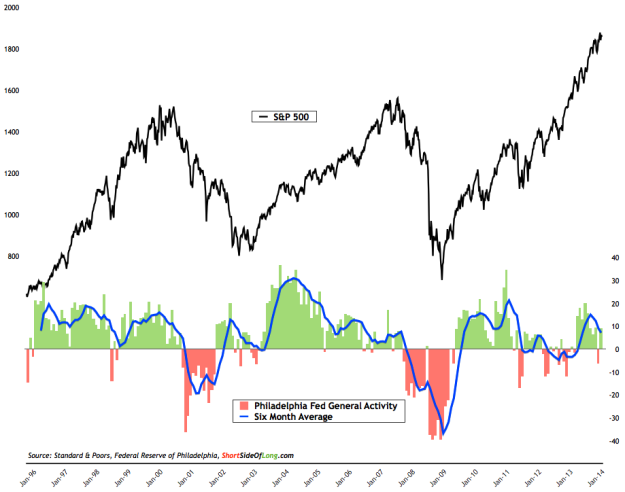
Chart 4: Philly Fed business conditions remain positive, but slowing…
United States Philadelphia Fed Business Activity has rebounded from the negative February number. While most economists continue to blame the cold weather for some of the recent volatile data, even before the negative print, the 6 month moving average was already declining. A deceleration in business sentiment could be connected to Fed’s QE taper, which is currently in progress to end sometime this year. Note: Just like consumer sentiment data, business confidence is one of the better contrary indicators to time long term equity purchases and sales. Philly Fed Index has averaged 8 over the last few decades, with a very high reading of 36 in January 2004 and very low reading of -39.6 in February 2009 (days before a generational low in the stock market).
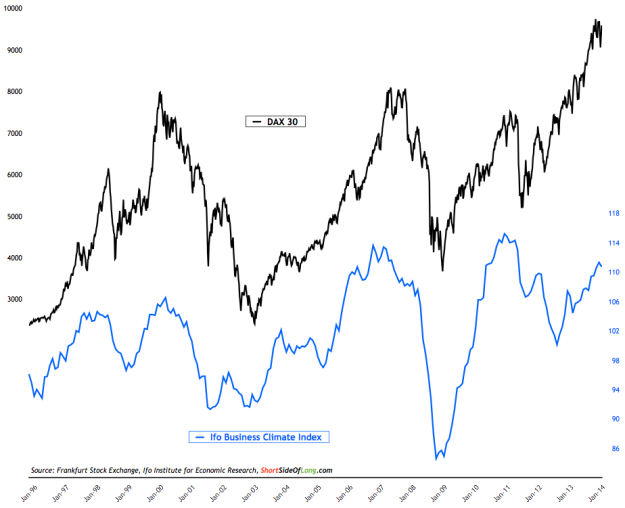
Chart 5: German CEOs are very bullish, a contrary signal for caution…
German lfo Business Climate Index has been strongly improving since middle of 2012, as its trough was closely linked to the infamous Draghi “whatever it takes” speech seen in the chart above. The sentiment has swung completely the other way for several quarters, towards optimistic levels last reached in 2006/07 just prior to the GFC and also in 2010/11 just prior to the Eurozone Debt Crisis. Bullish CEOs have been seen during major stock market peaks in 1998, 2000, 2007 and 2011. Caution is advised. Note: Just like consumer sentiment data, business confidence is one of the better contrary indicators to time long term equity purchases and sales. lfo business condition readings have averaged 102 over the last two decades, with a very high reading of 115 in February 2011 (just prior to a EU Crisis and DAX 30 crash) and a very low reading of 84.6 in December 2008 (during the GFC and two months away from the generational stock market low).
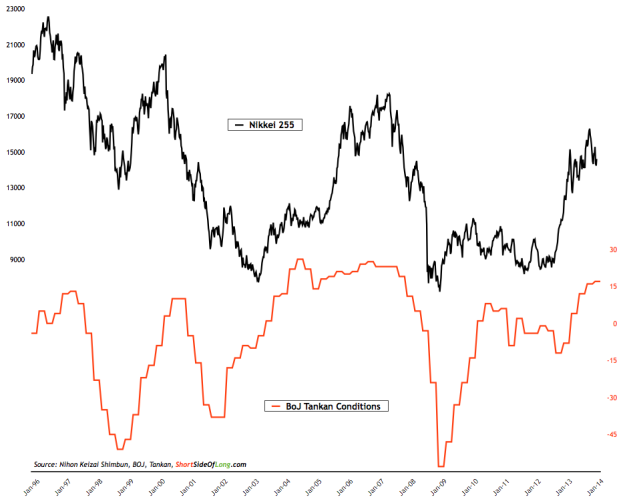
Chart 6: Japanese business sentiment continued to improve in Q1 2014
Japanese Tankan Manufacturing Conditions has also been improving very rapidly, similar to the German lfo sentiment readings. Interestingly, over a year ago, business sentiment bottomed in both of these economic regions, as central bank (ECB & BoJ) intervened by devaluing (printing) the local currency to boost exports. Currently, CEOs within these two exporting powerhouses of the world hold a very strong view on future prospects… usually a contrary signal for us investors. Once again – caution is advised. Note: Just like consumer sentiment data, business confidence is one of the better contrary indicators to time long term equity purchases and sales. Tankan conditions has averaged -3 over the last two decades, with a very high reading of 26 in July 2004 and a very low reading of -58 in March 2009 (right around the time the Nikkei 225 put in a 30 year low).
Lagging Indicators
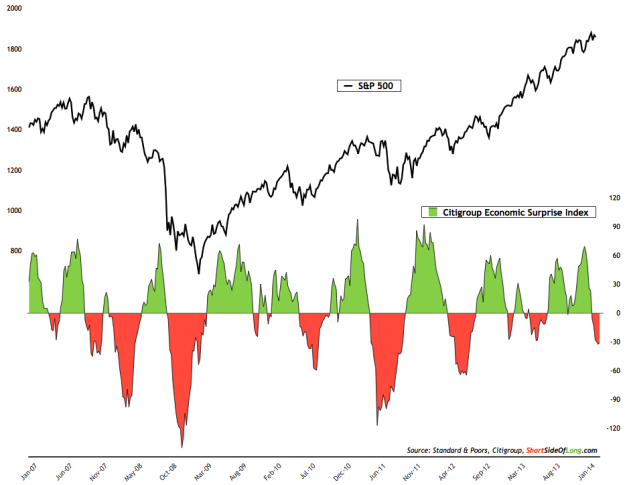
Chart 7: US macro economic data is now surprising to the downside
Note: economic data in general is lagging, while the stock market itself is a forward looking discount mechanism. That is why I rarely pay attention to industrial production, retail sales, GDP numbers, non farm payrolls or personal income. Even though media absolutely loves tracking these data points, paying attention to previous months economic activity is usually irrelevant and for traders / investors, similar to driving a car with a rear view mirror. However, the actual vs expected factor that the Citigroup index measures on the macro data is very relevant as a potential sentiment indicator against overly bullish / bearish economists.
Citigroup’s US Economic Surprise Index has been dropping lower into the negative territory throughout the month of March. Readings as of last week now stand at -31, which compares to -13 at the end of February (last months report). Economic data disappointing expectations is presently blamed on cold weather during the first quarter of the year, and together with the ongoing Fed money printing program, the stock market does not seem to be affected… just yet. The reason I say “yet”, is because recent SentimenTrader research shows that S&P 500′s performance tends to be subpar as economic data starts disappointing while the index is still pushing forward towards 52 week new highs. Just a possibility to keep in mind.
Monthly Commentary
The idea that global economy is doing well is far from the truth. Since 85% of the global economic activity is connected to Emerging Market economies, one has to wonder why the media obsesses on the other 15% (US and EU). I guess that is what media does best. Nevertheless, GEM equities have been under performing their developed market counterparts for a reason, and that reason is very simple: slower growth.
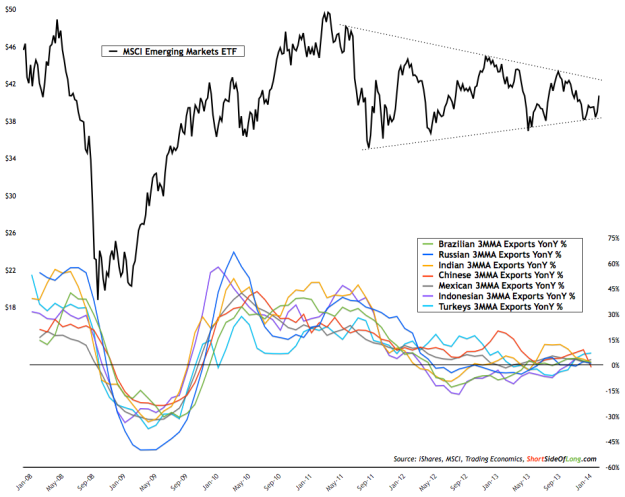
Chart 8: Markets lead economic data and anticipate booms & slowdowns
The chart above shows how the stock market does a great job discounting lagging economic data, such as year on year export growth. During the early and middle parts of 2008, the equity market started correctly anticipating a global economic slowdown, which later turned into a full blown crash. Interestingly, as the export data got worse in late 2008 and early 2009, the market was already basing and ready for a recovery. It turned out that the global economic activity sprung back very quickly, hence why the markets doubled in value within a year. But, economists and professors (like Nouriel Roubini who was bearish in 2009/10 and bullish right now) only really realised this by early 2010, when the lagging export data showed boom like conditions.
Even though global growth managed to stay above trend throughout majority of 2011, the equity market already started looking fishy in early parts of the year. Fast forward to August 2011 and a minor crash occurred, which correctly forecast yet another global slowdown. As we can clearly see now, global exports tracked by the E7 (Emerging 7 Economies) have barley been growing through the whole of 2012 and 2013.
Therefore, it should be pretty obvious as to why GEM equities have gone sideways in a long term technical consolation triangle. While the 2011 correction was a surprise to most economists at the time, investors who understand markets as discount mechanics realised that a more meaningful slowdown was in progress. After all, many GEM economies where trying to cool inflation at that point.
Chart 9: Previous global slowdowns in exports have led to GEM bottoms
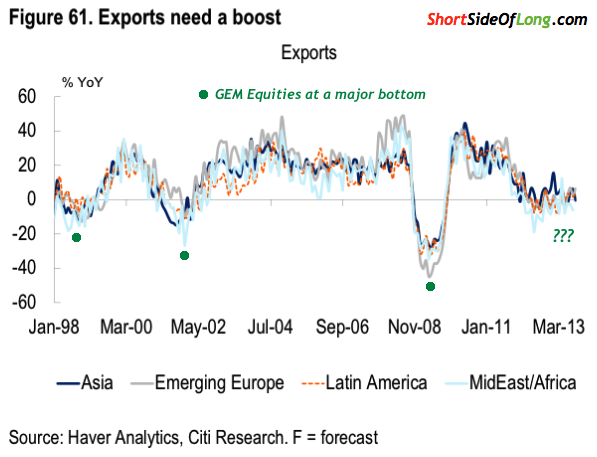
Source: Citigroup Research (edited by Short Side of Long)
So where to from here? All of us investors would like to know whether Emerging Market economies are going to recover or if we are headed for another crisis (EM Crisis as the pundits on CNBC and Bloomberg would like state). Personally, I would not trust any economist predictions on the future state of EM growth (all of whom constantly analyse lagging data) and would rather watch the market very closely, as the triangle in Chart 8 comes to a resolution.
I would like to remind investors that a further breakdown in GEM equities towards oversold levels would create an attractive longer term buying opportunity. Let us not forget that the MSCI EM Index is trading at 1.4 book value, which is historically quite cheap (a break lower would make it even cheaper). Furthermore, if we observe Chart 9 above, we should be able to notice that every major export slowdown has eventually led to a GEM equity bottom and a long term buying opportunity. In due time, I assume that this one will as well…

