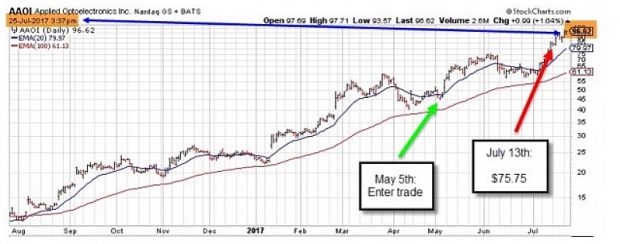
Covered call writing and cash-secured put-selling are conservative strategies geared to retail investors who have capital preservative as a key strategy requirement. When we use high implied volatility underlying securities the strategy will have a broader range of risk-reward exposure. This article was inspired by Randy P. who had outstanding results using Applied Opt (NASDAQ:AAOI) as the underlying. The trade and management choices will be evaluated and explained.
Randy’s trade as of 7/13/2017

- 5/5/2017: 600 shares of AAOI were purchased at $48.00 per share(green arrow)
- 5/5/2017: Sell 2 contracts of the 7/28/2017 $66.00 calls
- 5/5/2017: Sell 4 contracts of the 9/15/2017 $75.00 calls
- 7/13/2017: AAOI trading at $75.75 (red arrow)
- 7/25/2017 (Screenshot created and article written): AAOI trading at 96.62 (blue arrow at top of chart)
- 8/2/2017: Upcoming earnings report
Implied volatilities on 7/13/2017
The huge risk and high returns are easily defined by the following implied volatility stats (using a Greek calculator):
- S&P 500: 9%
- 7/28 $66.00 call: 50%
- 9/15 $75.00 call: 70%
Time value cost-to-close
When share value moves well above the strike sold, we check to see the time value cost-to-close. This is the amount of the option premium above intrinsic value. Although it will cost us significant cash to buy back deep in-the-money calls, the intrinsic value “buys up” share value from the strike sold to current market value so our main focus is on the time value component. After checking options chains and using mid-points of the spreads (slightly favoring market-maker prices), we learn that the time value costs-to-close are $4.00 (7/28 calls) and $9.00 (9/15 calls), both very expensive due to the high implied volatilities.
8/2/2017 earnings release
The 7/28 contracts expire prior to the report and the 9/15 calls are well after the report.
Position management considerations
7/28 calls
The percentile cost-to-close based on current share value ($66.00 due to option obligation) is 6.1% ($4.00/$66.00). Although we have the advantage of the huge price appreciation after this date, generally we would not spend that amount to roll the option and instead “allow assignment” The more aggressive and riskier plan would have been to buy back the option, hope for a positive earnings report and sell the next call after the report passes. The latter would have resulted in the best results but would not meet the capital preservation requirements of most conservative investors.
9/15 calls
The percentile cost-to-close on current share value ($75.00 due to option obligation) is 12% ($9.00/$75.00). Since the contract expiration is well after the 8/2/2017 earnings release date a decision must be made whether we want to spend 12% to protect against a negative report. The trade has already made huge profits so one may speculate that closing isn’t such a bad idea but given the 6 weeks remaining until contract expiration, taking no action and re-evaluating prior to the report is a viable approach.
Discussion
The type of securities we use as our underlyings for option-selling will depend on personal risk-tolerance. AAOI is a high risk/high reward stock. This may be appropriate for some and not for others. My personal preference (applies to me but certainly not to everyone) is to target 2-4% 1-month initial time value returns when setting up my trades and up to 6% in bull market environments. I rarely go above these parameters. There is no right or wrong here as one size does not fit all.
Many thanks to Randy for sharing this trade with us and inspiring this article.
For more information on position management of our covered call trades, see the exit strategy chapters of these books:
Market tone
This week’s economic news of importance:
- Weekly jobless claims: 261,000 (above expectations)
- Producer price index Dec: (-)0.1% (0.2% expected)
- Consumer price index Dec: 0.1% (as expected)
- Retail sales Dec: 0.4% (o.5% expected)
THE WEEK AHEAD
Mon Jan 15th
- None: Martin Luther King Jr. Day
Tue Jan 16th
- Empire state tax
Wed Jan 17th
- Industrial production
- Homebuilders Index
- Beige Book
Thu Jan 18th
- Weekly jobless claims for week ending 1/13/18
- Housing starts
- Building permits
- Philly Fed
Fri Jan 19th
- Consumer sentiment
For the week, the S&P 500 rose by 1.57% for a year-to-date return of 4.21%
Summary
IBD: Market in confirmed uptrend
GMI: 6/6- Buy signal since market close of August 31, 2017
BCI: I have a short-term bullish approach to the market, selling 2 out-of-the-money strikes for every 1 in-the-money strike.
WHAT THE BROAD MARKET INDICATORS (S&P 500 AND VIX) ARE TELLING US
The 6-month charts point to a bullish outlook. In the past six months, the S&P 500 was up 17% while the VIX (10.16) moved slightly up by 2%.
Wishing you much success,
