There is a strategy that involves writing out-of-the-money put options on stocks that you would be willing to buy. The problem (in my market addled mind) is that it is what I would call a “high maintenance strategy”. There is a lot of ongoing monitoring and a lot of “hands on” actions involved.
But there may be a way to have someone else do the legwork which doesn’t involve you actually having to be the one to make the trades.
Selling Naked Puts
The basic strategy works like this: if a stock is trading at $31 a share a trader might sell a put option with a strike price of $30. Let’s say the investor sells the put for $1 a contract. If the stock drops below 30 at option expiration the investor could take delivery of the stock at an effective price of $29 a share ($30 strike price minus $1 of option premium received). If the stock stays above $30 at expiration then the investor keeps the $1 of premium received and can write another put option if he or she desires.
The problems with this strategy is, a) you really have to pay attention to what’s going on with each position, and, b) you still have to be a reasonably decent stock picker. It’s great to buy a stock at $29 instead of $31 but if it subsequently drops to $25 then it’s not so great.
As I mentioned earlier, there may be a less “high maintenance” approach.
The CBOE Put/Write Index
The CBOE created an index call the Put/Write Index. There is now an ETF that tracks this index– the ticker symbol is NYSE:PUTW. What follows is a simple strategy using this index.
Jay’s Put/Write System
*Buy and hold the CBOE Put/Write Index November through July
*Buy and hold GNMA bonds August through October
The Test
For testing purposes we use:
*CBOE Put/Write Index month total return data from July 1986 through February 2016
*Ticker PUTW monthly total return data from March 2016 (when PUTW started trading) through June 2017
*Ticker VFIIX (Vanguard GNMA fund) total return data as a proxy for GNMA bonds
So the “system” (such as it is) holds PUTW November through July and VFIIX August through October.
Results
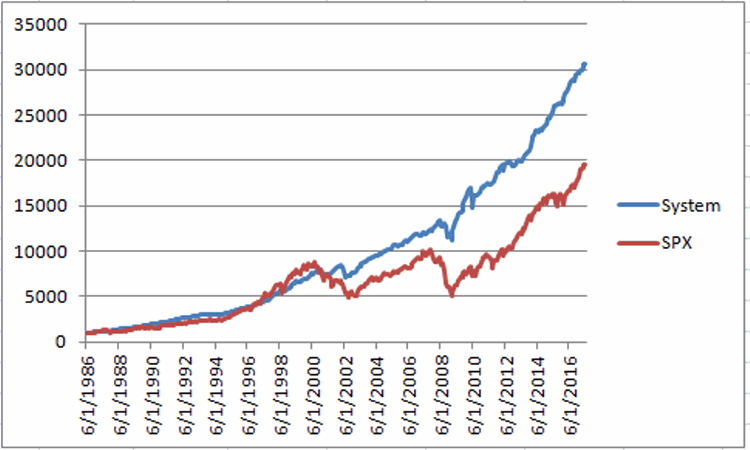
The equity curve for this test appears in Figure 1 along with the equity curve for the S&P 500 index on a buy-and-hold basis over the same time

Figure 1 – Jay’s Put/Write Systems versus SPX (July1986-June 2017)
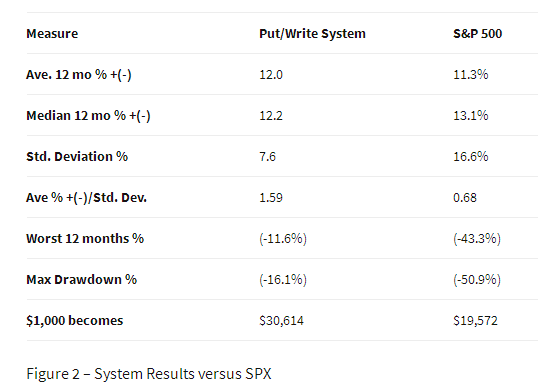
Some relevant performance comparisons appear in Figure 2

Summary
So is this a turnkey, ready-to-go, you can’t lose approach to investing? As always, there is no such thing. Still the long term results – particularly vis a vis the S&P 500 might make it an interesting place to start looking.
Disclaimer: The data presented herein were obtained from various third-party sources. While I believe the data to be reliable, no representation is made as to, and no responsibility, warranty or liability is accepted for the accuracy or completeness of such information. The information, opinions and ideas expressed herein are for informational and educational purposes only and do not constitute and should not be construed as investment advice, an advertisement or offering of investment advisory services, or an offer to sell or a solicitation to buy any security.
