Earlier this week I reviewed how the Global Market Index’s risk premium stacked up in historical terms vs. looking ahead. Or in the jargon of the investment industry, I profiled the ex post and ex ante risk premia for GMI, a passive benchmark of all the major asset classes. Today I’ll perform a similar round of quantitative surgery on the individual asset classes to round out the analysis.
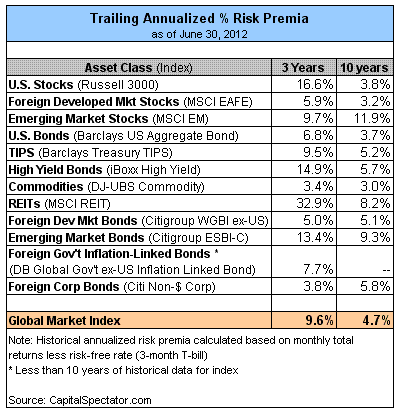
But first, let’s summarize where we’ve been. The first table below lists the risk premia for each of the major asset classes, along with the comparable numbers for GMI. Remember, we’re talking of risk premiums throughout—total returns less the risk-free rate, which I’m defining as the total return on a 3-month Treasury bill. Not surprisingly, the gap has narrowed substantially in recent years between total return and risk premia, thanks to persistence of near-zero yields on T-bills. The further back in time you look, however, the T-bill return rises and so the difference between risk premia and total return widens.
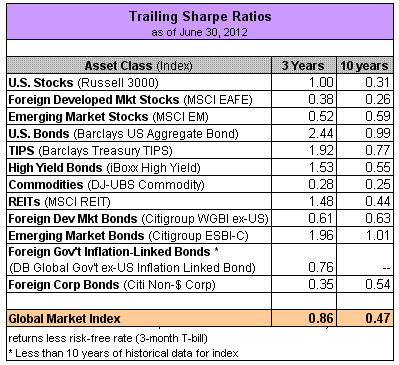
For another statistical trip down memory lane, consider how the major asset classes and GMI compare in recent history in terms of their respective Sharpe ratios, a popular risk metric that measures the ratio of excess return (risk premium) to volatility (standard deviation). The idea here is that the Sharpe ratio quantifies an asset’s earned risk premium per unit of risk taken. Higher Sharpe ratios equate with higher risk-adjusted return. Yes, like every other risk metric, the Sharpe ratio is flawed, as I discussed in an article in Financial Advisor: “Building A Better Sharpe Ratio.” There are, of course, a number of alternatives risk measures, but considering the popularity of the Sharpe ratio it’s a reasonable starting point for comparing risk-adjusted performance.
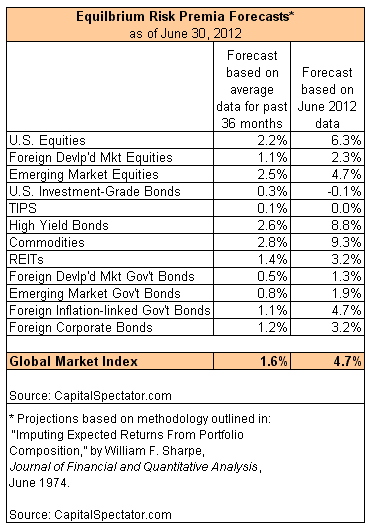
With the history lesson out of the way, let’s take a stab at estimating ex ante risk premia for the major asset classes and GMI. From here on out, the standard caveat applies, namely: We’re no longer in Kansas, Dorothy. No one should confuse forecasts with the hard data of the past. But we need a foundation for looking forward. There are many ways to proceed, but as a starting point I offer the following ballpark estimates.
The summary of this exercise is listed in the third table below. I generated two sets of forecasts, listed in the next table below. One is based on averaging the inputs over the 36 months through June 2012. The second set of forecasts uses only the June 2012 data points. Again, keep in mind that the estimates in the table below are risk premia. To calculate the total return estimates, simply add your outlook for the risk free rate. The basic formula: GMI's Sharpe ratio * the volatility of the asset class * the correlation of the asset class vis-a-vis GMI.
How exactly did I come up with the forecasts above? Briefly, I'm using a slightly adjusted framework originally laid out by Professor Bill Sharpe in a 1974 paper in the Journal of Financial and Quantitative Analysis: "Imputing Expected Returns From Portfolio Composition." For a slightly less-geeky overview, see the "Reverse Optimization" section in Thomas Idzorek’s monograph or Chapter 3 by Gary Brinson in The Portable MBA in Investment I also discuss the basic process in Chapter 9 of my book Dynamic Asset Allocation
It all boils down to what's known as equilibrium estimates of expected return, or forecasts that assume that the markets clear in the long run. Estimating risk premia this way has pros and cons. On the plus side, the forecasts don't attempt to estimate returns directly, which is quite difficult compared with the slightly easier task of estimating risk. Rather, the returns are implied by way of estimating risk, namely: ex ante numbers for volatility, correlations, and GMI's Sharpe ratio. (By the way, for the risk premia forecasts, I use a simple GARCH (1,1) model to calculate volatility. I make some basic assumptions about future correlations with GMI from these estimates on vol. I also calculate what's known as a modified Sharpe ratio for the forecasts. By contrast, for the historical data in the first two tables above, I'm using a standard definition of Sharpe ratio and volatility is defined in those cases as standard deviation.)
The flaws of equilibrium estimates of risk premia (everything has flaws, of course) is that the markets don't always clear in the short term, and perhaps not at all. To the extent that we can use the forecasts derived from this methodology, it's for looking well down the line. In other words, day traders and speculators should avert their eyes.
So, what's the value here? As Bob Litterman advised a few years back in Modern Investment Management: An Equilibrium Approach,
We need not assume that markets are always in equilibrium to find an equilibrium approach useful. Rather, we view the world as a complex, highly random system in which there is a constant barrage of new data and shocks to existing valuations that as often as not knock the system away from equilibrium. However, although we anticipate that these shocks constantly create deviations from equilibrium in financial markets, and we recognize that frictions prevent those deviations from disappearing immediately, we also assume that these deviations represent opportunities.
In other words, volatility can be our friend by way of exploiting rebalancing opportunities in a multi-asset class portfolio. If we make some reasonable, conservative assumptions about risk premia, and stand at the ready to rebalance when volatility rises to something more than average, we may be in the sweet spot for taking advantage of Mr. Market's bi-polar personality.
Granted, the estimates above aren't likely to be perfect. In fact, they're sure to be wrong to some degree. That's the nature of forecasting--lots of uncertainty. But we have to start somewhere, and the above process has lots of appeal as the first step on a thousand-mile-journey.
More generally, why should we seriously consider GMI's risk premia as strategic information, either in historical or ex ante terms? One reason is that GMI's passive asset allocation has a history of competitive performance relative to a broad set of actively managed multi-asset class funds. That doesn't mean that GMI is a prudent strategy for everyone, or even anyone. But it does suggest that GMI is a valuable benchmark for considering how to design and manage an investment strategy and analyze actively managed portfolios.
The first question that arises from all of this: Should your customize GMI for building an investment portfolio? There are many reasons why we should answer "yes." Then again, if you're responding "yes" because you think it's easy to beat GMI in the long run or even medium term, here's a bit of unsolicited advice: Think again.
- English (UK)
- English (India)
- English (Canada)
- English (Australia)
- English (South Africa)
- English (Philippines)
- English (Nigeria)
- Deutsch
- Español (España)
- Español (México)
- Français
- Italiano
- Nederlands
- Português (Portugal)
- Polski
- Português (Brasil)
- Русский
- Türkçe
- العربية
- Ελληνικά
- Svenska
- Suomi
- עברית
- 日本語
- 한국어
- 简体中文
- 繁體中文
- Bahasa Indonesia
- Bahasa Melayu
- ไทย
- Tiếng Việt
- हिंदी
Major Asset Classes: Ex Ante Risk Premia
Published 07/14/2012, 11:31 PM
Updated 07/09/2023, 06:31 AM
Major Asset Classes: Ex Ante Risk Premia
3rd party Ad. Not an offer or recommendation by Investing.com. See disclosure here or
remove ads
.
Latest comments
Install Our App
Risk Disclosure: Trading in financial instruments and/or cryptocurrencies involves high risks including the risk of losing some, or all, of your investment amount, and may not be suitable for all investors. Prices of cryptocurrencies are extremely volatile and may be affected by external factors such as financial, regulatory or political events. Trading on margin increases the financial risks.
Before deciding to trade in financial instrument or cryptocurrencies you should be fully informed of the risks and costs associated with trading the financial markets, carefully consider your investment objectives, level of experience, and risk appetite, and seek professional advice where needed.
Fusion Media would like to remind you that the data contained in this website is not necessarily real-time nor accurate. The data and prices on the website are not necessarily provided by any market or exchange, but may be provided by market makers, and so prices may not be accurate and may differ from the actual price at any given market, meaning prices are indicative and not appropriate for trading purposes. Fusion Media and any provider of the data contained in this website will not accept liability for any loss or damage as a result of your trading, or your reliance on the information contained within this website.
It is prohibited to use, store, reproduce, display, modify, transmit or distribute the data contained in this website without the explicit prior written permission of Fusion Media and/or the data provider. All intellectual property rights are reserved by the providers and/or the exchange providing the data contained in this website.
Fusion Media may be compensated by the advertisers that appear on the website, based on your interaction with the advertisements or advertisers.
© 2007-2024 - Fusion Media Limited. All Rights Reserved.
