
LPL Financial Holdings Inc.’s (NASDAQ:LPLA) activity report for October 2018 reflects deterioration from the prior month. The company’s total brokerage and advisory assets of $649.3 billion at the end of October were down 4.7% sequentially. Of the total brokerage and advisory assets, brokerage assets were $357.5 billion while advisory assets totaled $291.7 billion.
Additionally, total net new assets were an inflow of $2.2 billion in October. This included $0.3 billion of outflows from a small number of hybrid firms, in line with LPL Financial’s expectations as discussed during its second quarter and third-quarter 2018 earnings calls. Prior to these outflows, total net new assets were an inflow of $2.5 billion.
LPL Financial reported $29.1 billion of total client cash sweep balances for October, up 3.2% sequentially. Of the total, $21.4 billion was insured cash, $4.2 billion was deposit cash while the remaining $3.5 billion was money market cash balance.
With the gradual stabilization of equity markets, trading activities are anticipated to improve. However, dismal top-line growth poses a near-term concern.
Shares of LPL Financial have declined 5.8% over the past three months compared with the industry’s fall of 10.5%.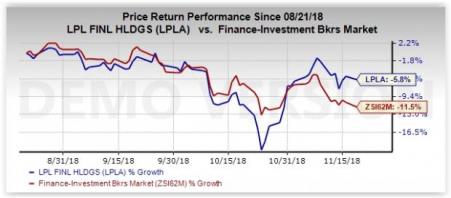
LPL Financial currently carries a Zacks Rank #3 (Hold). You can see the complete list of today’s Zacks #1 Rank (Strong Buy) stocks here.
Performance of Other Investment Brokers
E*TRADE Financial (NASDAQ:ETFC) has reported a rise in Daily Average Revenue Trades (DARTs) for October 2018. According to its monthly market activity, the company’s DARTs came in at 301,625, up 7% from the previous month and 40% year over year. Notably, derivatives comprised 32% of DARTs in October.
Interactive Brokers Group’s (NYSE:IBKR) Electronic Brokerage segment reported year-over-year increase in DARTs for October. The segment deals with clearance and settlement of trades for individual and institutional clients globally. Total client DARTs came in at 986,000, surging 41% from October 2017 and 22% from September 2018.
Charles Schwab’s (NYSE:SCHW) monthly activity for October 2018 reflects year-over-year rise. Total client assets were $3.4 trillion at the end of the month, increasing 4% from the year-ago month.
Will You Make a Fortune on the Shift to Electric Cars?
Here's another stock idea to consider. Much like petroleum 150 years ago, lithium power may soon shake the world, creating millionaires and reshaping geo-politics. Soon electric vehicles (EVs) may be cheaper than gas guzzlers. Some are already reaching 265 miles on a single charge.
With battery prices plummeting and charging stations set to multiply, one company stands out as the #1 stock to buy according to Zacks research.
It's not the one you think.
See This Ticker Free >>
E*TRADE Financial Corporation (ETFC): Free Stock Analysis Report
Interactive Brokers Group, Inc. (IBKR): Free Stock Analysis Report
LPL Financial Holdings Inc. (LPLA): Free Stock Analysis Report
The Charles Schwab Corporation (SCHW): Free Stock Analysis Report
Original post
Zacks Investment Research
- English (UK)
- English (India)
- English (Canada)
- English (Australia)
- English (South Africa)
- English (Philippines)
- English (Nigeria)
- Deutsch
- Español (España)
- Español (México)
- Français
- Italiano
- Nederlands
- Português (Portugal)
- Polski
- Português (Brasil)
- Русский
- Türkçe
- العربية
- Ελληνικά
- Svenska
- Suomi
- עברית
- 日本語
- 한국어
- 简体中文
- 繁體中文
- Bahasa Indonesia
- Bahasa Melayu
- ไทย
- Tiếng Việt
- हिंदी
LPL Financial (LPLA) Reports Decline In October Metrics
Published 11/19/2018, 08:02 PM
Updated 07/09/2023, 06:31 AM
LPL Financial (LPLA) Reports Decline In October Metrics
Latest comments
Loading next article…
Install Our App
Risk Disclosure: Trading in financial instruments and/or cryptocurrencies involves high risks including the risk of losing some, or all, of your investment amount, and may not be suitable for all investors. Prices of cryptocurrencies are extremely volatile and may be affected by external factors such as financial, regulatory or political events. Trading on margin increases the financial risks.
Before deciding to trade in financial instrument or cryptocurrencies you should be fully informed of the risks and costs associated with trading the financial markets, carefully consider your investment objectives, level of experience, and risk appetite, and seek professional advice where needed.
Fusion Media would like to remind you that the data contained in this website is not necessarily real-time nor accurate. The data and prices on the website are not necessarily provided by any market or exchange, but may be provided by market makers, and so prices may not be accurate and may differ from the actual price at any given market, meaning prices are indicative and not appropriate for trading purposes. Fusion Media and any provider of the data contained in this website will not accept liability for any loss or damage as a result of your trading, or your reliance on the information contained within this website.
It is prohibited to use, store, reproduce, display, modify, transmit or distribute the data contained in this website without the explicit prior written permission of Fusion Media and/or the data provider. All intellectual property rights are reserved by the providers and/or the exchange providing the data contained in this website.
Fusion Media may be compensated by the advertisers that appear on the website, based on your interaction with the advertisements or advertisers.
© 2007-2024 - Fusion Media Limited. All Rights Reserved.