The latest and previous stock market corrections could be described as “tightening tantrums.” Investors fretted that the Fed would be raising interest rates faster than had been widely perceived. That was not the case in 2016, when the federal funds rate was raised but only once at the end of the year. There were three widely expected rate hikes in 2017. At the start of this year, investors were anticipating three more rate hikes prior to the release of the wage numbers on February 2.
For stock investors, concerns about the rate hikes during 2017 were more than offset by strong earnings growth attributable to improving global economic growth. The recent correction occurred despite the huge boost to earnings provided by the Tax Cut and Jobs Act (TCJA) at the end of last year. The knee-jerk conclusion of knee-jerk market pundits was that the stock market is adjusting to a period of reduced “liquidity.” This is a concept that I have yet to find a way to suitably quantify. Among the community of instant market pundits, it seems that liquidity is ample when stock prices are rising and scarce when stock prices are falling. Consider the following:
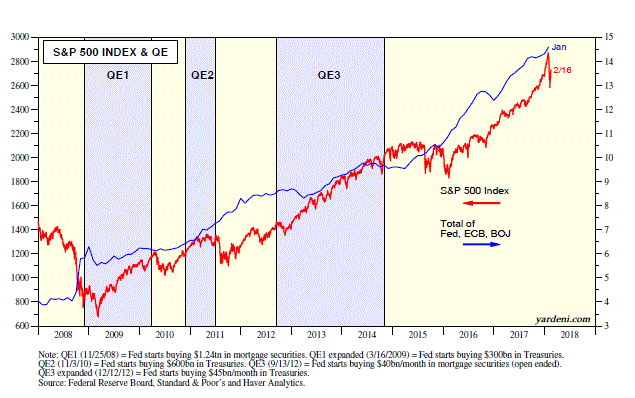
(1) Central bank balance sheets. The more thoughtful liquidity pundits have focused on the balance sheets of the Fed, ECB, and BOJ. They warned that stock prices would plunge once the Fed terminated QE, which happened at the end of October 2014. The S&P 500 is up 35.4% since then!
The Fed started to taper its balance sheet at the start of October last year by letting securities mature without replacing them. The S&P 500 is up 6.1% since then, but the liquidity pundits can argue that the recent correction shows that the stock market is starting to worry about a dearth of Fed-given liquidity. Meanwhile, during January, the sum of the assets held by the Fed, ECB, and BOJ rose to a new record high of $14.6 trillion, led by the ECB.
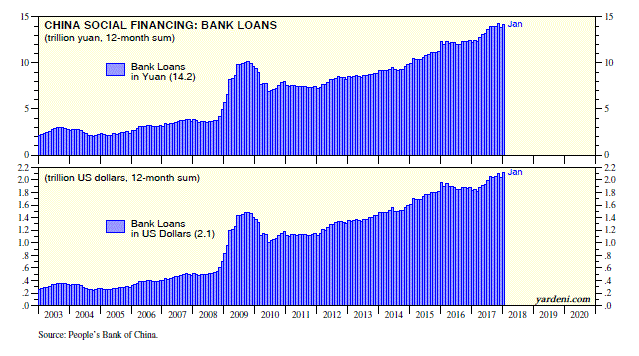
(2) Chinese bank loans. Often overlooked by the liquidity pundits are developments in China. I monitor the balance sheet of the PBOC. I give even more weight to Chinese commercial bank loans as a measure of liquidity in China. I am amazed, though not surprised, that these loans soared $418 billion during January m/m and a record $2.1 trillion y/y.
(3) Repatriated earnings and buybacks. We find it hard to believe that the stock market suddenly has a liquidity problem given that a couple of trillion dollars in corporate earnings retained abroad are about to be repatriated thanks to the TCJA. The cumulative total of such earnings of nonfinancial corporations since Q1-1986 through Q3-2017 is $3.5 trillion. A significant portion of these funds is expected to come back and be used for share buybacks and dividend payments, which have been the two major sources of funds driving the current bull market.
(4) Earnings. Last but not least is all the liquidity provided by the tax cuts at the end of last year. Over the past nine weeks through last week, industry analysts have raised their 2018 estimate for S&P 500 earnings per share by $11.21 from $146.26 to $157.47. That’s a 7.7% increase.

