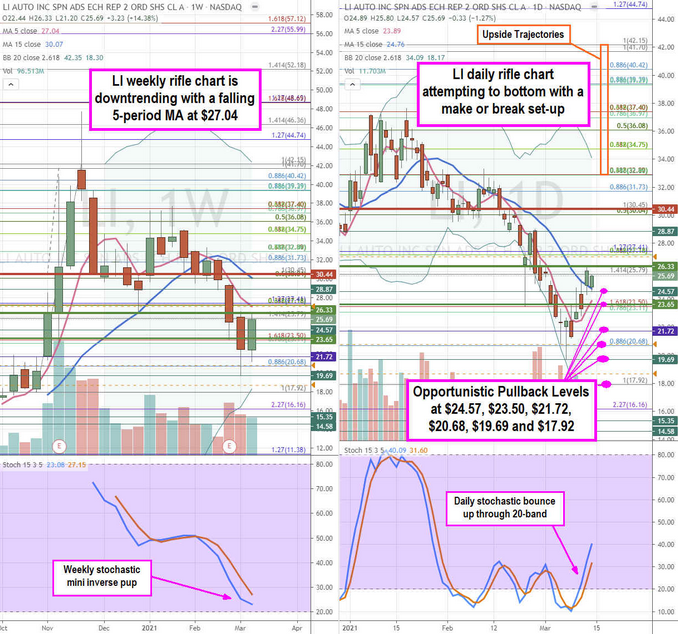
Chinese electric vehicle (EV) maker Li Auto Inc (NASDAQ:LI) shares have been selling off since peaking at $47.70 highs in November 2020 at the height of the EV momentum period. The Li ONE SUV does up to 800km per charge distance with a 40.5 kWh battery does zero-to-100km in 6.5 seconds with up to 7-seat capacity. The vehicle has four screens, voice interaction and automatic parking with a four-motor-wheel drive. With so many EV makers still in the concept stage scheduled for commercial rollout but yet to produce EVs, Li Auto is among the big three Chinese EV makers including Nio (NYSE:NIO) and Xpeng (NYSE:XPEV) that are already delivering vehicles and providing triple-digit delivery metrics monthly. Li has the highest vehicle margin among its peers at nearly 18%. Risk tolerant investors looking in gain exposure in the China EV market can monitor opportunistic pullback levels in Li Auto to consider scaling into a position.
Q4 2020 Earnings Release
On Feb. 25, 2021, Li Auto released its fiscal fourth-quarter 2020 results for the quarter ending December 2020. The Company reported an adjusted earnings-per-share (EPS) profit of $0.02 excluding non-recurring items versus consensus analyst estimates for a loss of (-$0.05), a $0.07 EPS beat. Revenues rose 65.2% year-over-year (YOY) to $635.5 million, beating estimates for $604.5 million. The Company issued upside guidance for Q1 2021 with revenues between $450.6 million to $493.5 million and vehicle deliveries between 10,500 to 11,500, up 263% to 297%. The Company ended 2020 with 52 retail stores in 41 cities and 114 servicing centers.
Conference Call Takeaways
Li Auto President, Kevin Yanan Shen set the tone:
“With 32,624 vehicles delivered to our users in 2020, Li ONE was the best-selling new energy SUV of the year in China, a testament to its highly competitive product features… We believe that evolving customer preferences for smart electric vehicles together with advancing technologies will continue to be tailwinds for our long-term sales growth.”
As of Jan. 31, 2021, Li Auto had 60 retail stores in 47 cities and 121 servicing centers and authorized body shots operating in 89 cities. As of Feb. 28, 2021, the Company had users in 338 cities with cumulative mileage exceeding 330 million kilometers and a 97.1% satisfaction. The Company is preparing for its full-size SUV rollout in 2022. The next-gen full-size premium SUV will incorporate the NVIDIA (NASDAQ:NVDA) Orin SoC chipset that can expand computing power to over 2,000 TOPS with the goal of progressively reaching level-4 autonomous driving.
February 2021 Deliveries
On Mar. 2, 2021, Li Auto reported February 2021 vehicle deliveries of 2,300 Li ONEs, up 755% YoY. Total cumulative deliveries rose to 41,276 vehicles. Needham upgraded shares of Li Auto to a Buy rating with a $37 price target. The recent sell-off in EV stocks presents opportunistic pullback levels for prudent investors and nimble traders to willing to take on the risks.

LI Opportunistic Pullback Levels
Using the rifle charts on the weekly and daily time frame provides a near-term view of the landscape for LI stock. After peaking at a high of $47.70, shares have been in a steep downtrend. The weekly rifle chart downtrend has a falling 5-period moving average (MA) resistance at the $27.04 followed by the weekly 15-period MA at the $30.04 Fibonacci (fib) level. The weekly market structure low (MSL) buy triggers above the $26.33. The weekly market structure high (MSH) sell triggered on the $30.44 breakdown. The weekly stochastic has a bearish mini inverse pup nearing the 20-band oversold level where it can coil or fall for a climactic low. The daily rifle chart is attempting to bottom with a $23.65 MSL trigger as the daily 5-period MA attempts to form a rising support at $23.89 as the stochastic crossed up through the 20-band. The daily 15-period MA is also trying to hold support at $24.76. This make or break set-up can result in the bullish case of a 5-period MA crossover through the 15-period MA as the channel tightening rises to the weekly MSL trigger towards the weekly 5-period MA resistance. The bear case is a breakdown back under the daily 5-period MA as the daily stochastic crosses back down taking shares towards the weekly lower BBs near the $17.92 fib. Prudent investors and nimble traders can monitor opportunistic pullback levels at the $24.57 fib, $23.65 daily MSL, $21.72, $20.68 fib, $19.69 and the $17.92 fib. Keep an eye on peers NIO, Xpeng and Kandi Technologies (NASDAQ:KNDI). Upside trajectories range from the $32.88 fib up towards the $42.15 fib.
