
Lennar Corporation (NYSE:LEN) surpassed expectations on both counts for the sixth time in a row.
The company’s second-quarter fiscal 2017 adjusted earnings of 91 cents per share surpassed the Zacks Consensus Estimate of 78 cents by 16.7%. Earnings decreased 4.2% from the year-ago level of 95 cents.
Expenses related to Lennar’s acquisition of WCI Communities, Inc. hurt its second-quarter earnings.
Total revenue of $3.26 billion beat the Zacks Consensus Estimate of $2.89 billion by almost 12.8%. Revenues also grew 18.8% year over year as the homebuilding, financial services, Rialto and multi-family segments performed significantly well.
Segment Details
Homebuilding : Segment revenues increased 17.7% year over year to $2.89 billion driven by higher number of homes delivered. Within this, home sales constituted $2.87 billion (up 18.1% year over year) and land sales accounted for $15.4 million (down 27.8%).
New home orders increased 12% year over year to 8,898 in the fiscal second quarter. The potential value of net orders increased 17% year over year to $3.4 billion.
Home deliveries were up 15% year over year to 7,710, buoyed by higher number of homes delivered across all homebuilding segments.
The average selling price (ASP) of homes delivered was $374,000, increasing 3.3% year over year.
In the quarter under review, backlog grew 13% year over year to 10,201 homes. Potential housing revenues from backlog increased 20% year over year to $4 billion.
The company increased sales incentives during the quarter. Lennar’s sales incentives comprised 5.7% of home sales revenues in the fiscal second quarter, flat year over year but down 20 basis points sequentially.
Margins
Gross margin on home sales declined 160 bps to 21.5% owing to rising land and construction costs. However, it improved 40 basis points sequentially.
As a percentage of sales, SG&A expenses remained flat at 9.3%.
Financial Services: Financial Services revenues increased 18.4% to $208.4 million in the quarter. Operating earnings at the segment were $43.7 million, down from $44.1 million a year ago.
Rialto Investments: Rialto Investments’ revenues of $68 million increased 51.6% year over year.
The segment reported operating loss of $6.4 million in the quarter compared with $18.1 million loss a year ago.
Lennar Multi-Family: Lennar Multi-Family revenues of $99.8 million increased 34.6% in the reported quarter from $74.2 million in the prior-year quarter.
The segment’s operating income was $6.5 million in the second quarter against $14.9 million in the year-ago quarter.
Financials
Lennar Homebuilding’s cash and cash equivalents totaled $747.7 million as of May 31, 2017, up from $1,050.2 million as of Nov 30, 2016. Net Lennar Homebuilding debt was $5.02 billion as of May 31, 2017 compared with $3.53 billion as of Nov 30, 2016.
Zacks Rank & Other Key Picks
Lennar currently carries a Zacks Rank #2 (Buy).
Other favorably ranked stocks in the construction sector include Lyon William Homes (NYSE:WLH) , M/I Homes, Inc. (NYSE:MHO) and KB Home (NYSE:KBH) .
M/I Homes sports a Zacks Rank #1 (Strong Buy) and is likely to witness a 36.2% rise in earnings. You can see the complete list of today’s Zacks #1 Rank stocks here.
Lyon William, a Zacks Rank #2 stock, is expected to exhibit 38.4% growth in 2017 earnings.
KB Home, also a Zacks Rank #2 stock, is expected to witness 43.3% growth in fiscal 2017 earnings.
Lennar Corporation Price, Consensus and EPS Surprise
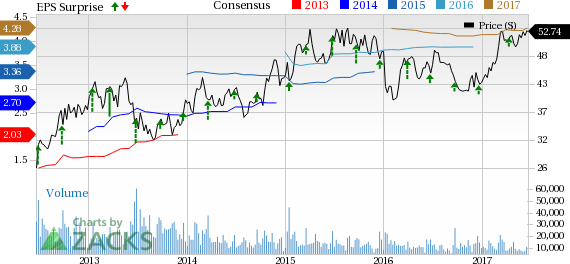
Lennar Corporation Price, Consensus and EPS Surprise | Lennar Corporation Quote
Looking for Stocks with Skyrocketing Upside?
Zacks has just released a Special Report on the booming investment opportunities of legal marijuana.
Ignited by new referendums and legislation, this industry is expected to blast from an already robust $6.7 billion to $20.2 billion in 2021. Early investors stand to make a killing, but you have to be ready to act and know just where to look. See the pot trades we're targeting>>
Lennar Corporation (LEN): Free Stock Analysis Report
KB Home (KBH): Free Stock Analysis Report
M/I Homes, Inc. (MHO): Free Stock Analysis Report
Lyon William Homes (WLH): Free Stock Analysis Report
Original post
Zacks Investment Research