As an investor, you might follow today’s news to gauge markets. A chartist evaluates daily, weekly, and monthly charts. The fundamentalist might add a few hundred years of market behavior and data to conclude, but what if these cycle time frames aren’t long enough?
It is not a secret anymore that silver is in a boom
- The investor is digesting pandemic news for nearly a year now. And the newly termed phrase at the World Economic Forum: “In 2030, you will own nothing and be happy” makes one think twice.
- The chartist finds himself for almost a year in a bullish trend in silver. This after silver trading in a range for seven years. He/She sees gold on the top of the list of ‘Top assets by market cap’ with silver ranking 6th and Bitcoin ranking 9th.
- The market participant focused on fundamentals and market cycles is wondering how long the dollar will hold up as a fiat currency. Typically (over the last 600 years), a fiat currency hyperinflates after 93 years.
Nevertheless, the question of “How much” is one to be answered, and it could be much larger time cycles that provide guidance there.
The world viewed from a different angle might give clues
- Toddlers have anxiety symptoms which can manifest in not eating properly, quickly getting angry or irritable, and being out of control during outbursts as well as constantly worrying or having negative thoughts and feeling tense and fidgety.
- Social Media addiction among teens and young adults has exploded leading to an inability to stop or curb this addictive behavior despite suffering losses in friendship, decreased physical social engagement, and a negative impact at school.
- Worldwide obesity has nearly tripled since 1975. In 2016, more than 1.9 billion adults, 18 years and older, were overweight. Of these over 650 million were obese.
- The elderly are unwanted in a production-oriented society that measures human value by productivity rate.
- Yet, pet clothing stores and fresh pet food sections in grocery chain stores are becoming the norm.
- Any endeavors, including the arts, are measured against the benchmark of profitability. Resulting in the worship of money over beauty, ethics, and principles.
The list goes on and could point as far back as to decadent times before the fall of Rome.
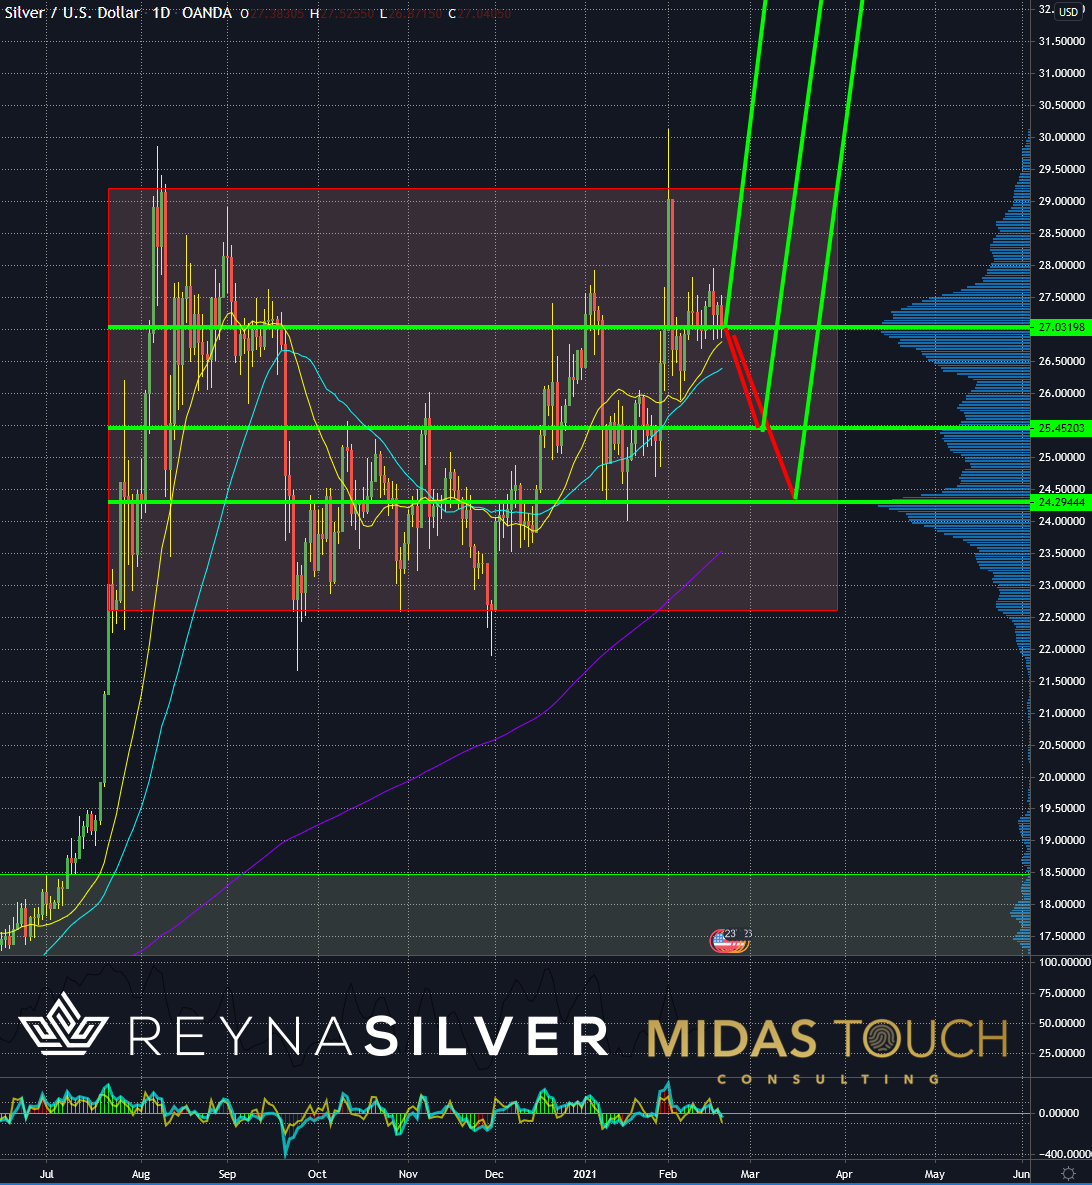
Daily chart of silver, range trading

One part that has changed over time is the integrity of the markets. Free markets and their principle benefits are endangered. And then typically lies have short legs, and truth prevails.
While silver prices are still held in a range by artificial shorts, the cost of physical silver much more accurately describes its value increase.
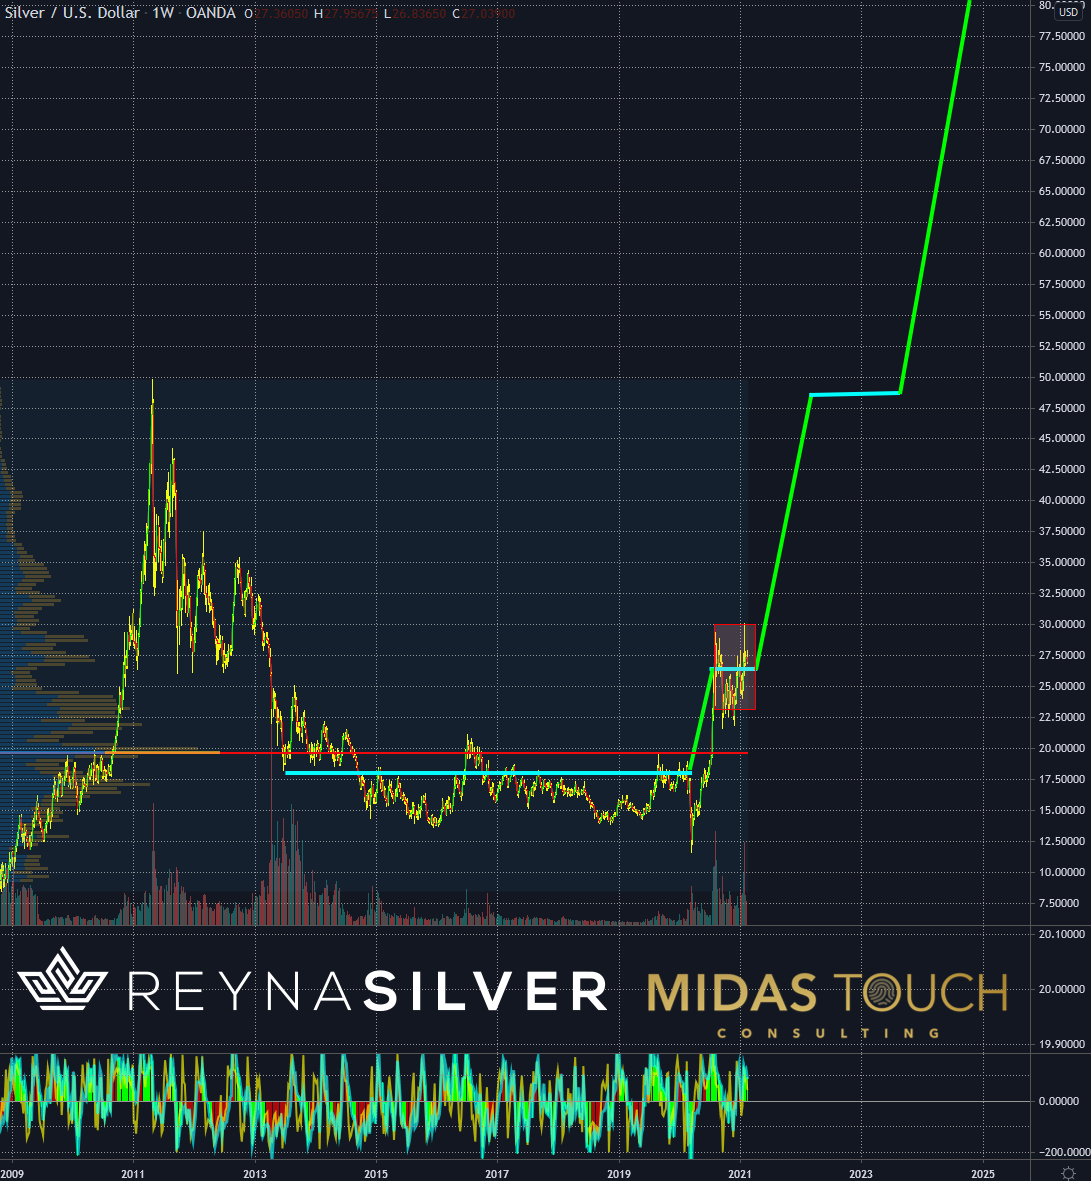
Weekly chart of silver, one deep breath and go

Once desperate bears have to give way to silver’s real value and demand, we most likely see price-advances much more significant than generally assumed.
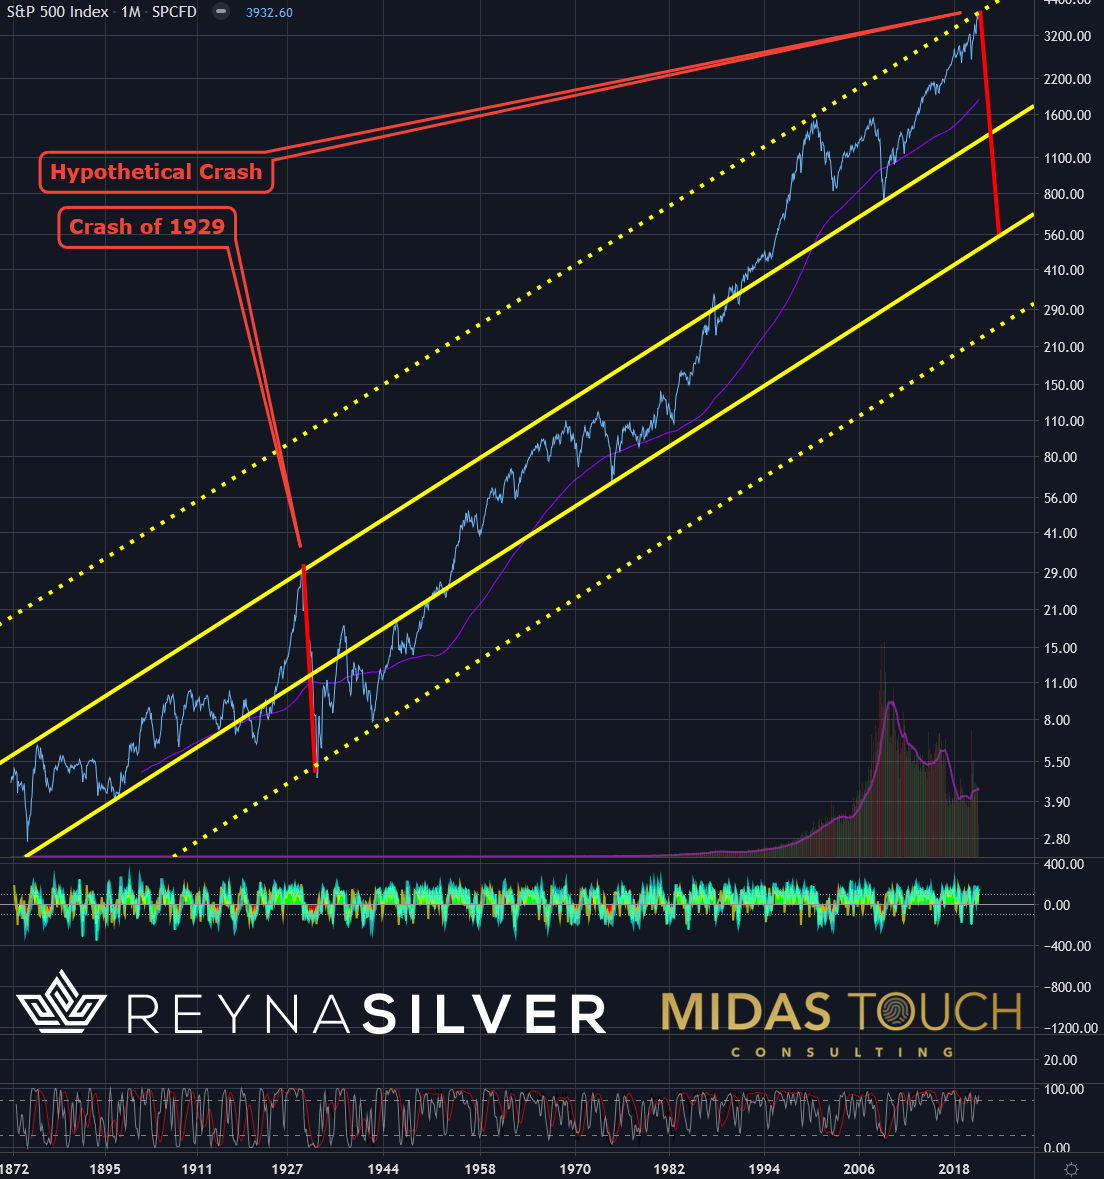
S&P 500 Index in US Dollar, monthly chart, large silver cycles

A view at the S&P 500 chart above from a professional chartist’s perspective would qualify the hypothetical crash scenario, not as an abnormality but rather a typical scenario after advances this extended in time.
In Rome, the leading coin used was the Denarius. With a 90% silver content (4.5 grams per coin), it was equal to a day’s work wages. Rome’s prosperity came from barter, and a finite amount of Silver came into the empire. Within 75 years, the Silver content per coin was diluted down to only 5%. Various emperors did this to finance wars and extravaganza. It was mainly hyperinflation that broke the empire. Sounds familiar?
Large Silver cycles
Our intent is not to judge the world and the state it finds itself in, but markets reflect in cycles, and any view larger than one’s lifetime is hard to gauge. We might be in the midst of a market phase where next time around, we get a severe market correction; it might get ugly in a hurry. The result might be more dramatic than the corrections we have seen in the last 20 years. In this case, a look as far back as the Romans could be useful to determine how aggressively we hedge our bets, how much we buy into physical Silver. It looks like a few extra ounces couldn’t hurt.
