Get 40% Off
These stocks are up over 10% post earnings. Did you spot the buying opportunity? Our AI did.Read how

Large Cap Growth And Momentum Dominate 2020 Factor Returns

Published 07/10/2020, 07:08 AM
Updated 07/09/2023, 06:31 AM

If your US equity strategy is posting a gain this year there’s a good chance that the key driver is a hefty allocation to either the large-cap growth, or momentum factors. These are the only two factor strategies posting gains so far in 2020, based on a set of exchange-traded funds. Otherwise, red ink rules, based on numbers through July 9.

Large-cap growth is the top-performing equity factor via iShares S&P 500 Growth (NYSE:IVW). The fund is up a bit more than 12% so far in 2020. After yesterday’s rally, IVW ended the trading session at a record high.
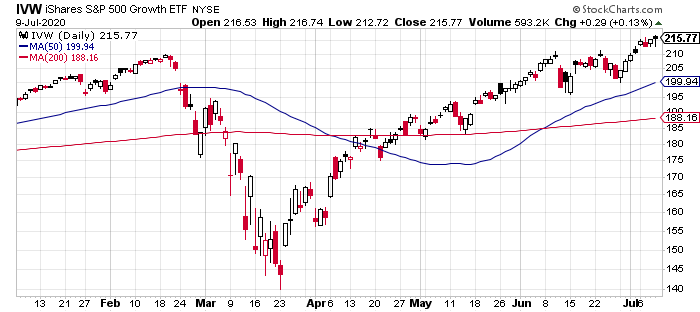
IVW Daily Chart

A close second-place performer: iShares Edge MSCI USA Momentum Factor (NYSE:MTUM), which posted an 11.2% total return through Thursday’s close.

The rest of the factor field continues to suffer varying degrees of loss, ranging from a mild 3.0% year-to-date decline for iShares Edge MSCI USA Quality Factor (NYSE:QUAL) to a deep 28.4% tumble in iShares S&P Small-Cap 600 Value (NYSE:IJS).
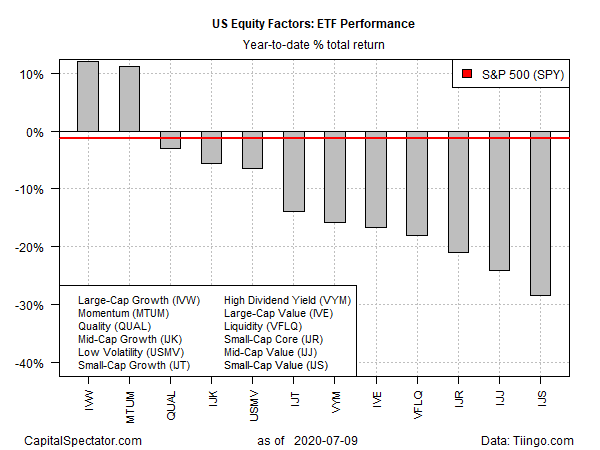
US Equity Factors YTD Total Returns Chart

The broad market is also slightly underwater year to date, based on SPDR S&P 500 (NYSE:SPY). At yesterday’s close, SPY was down 1.3% for the year. Although the fund has bounced back sharply after the March correction, SPY has been in a trading range in recent weeks and has yet to fully recover from the previous drawdown.
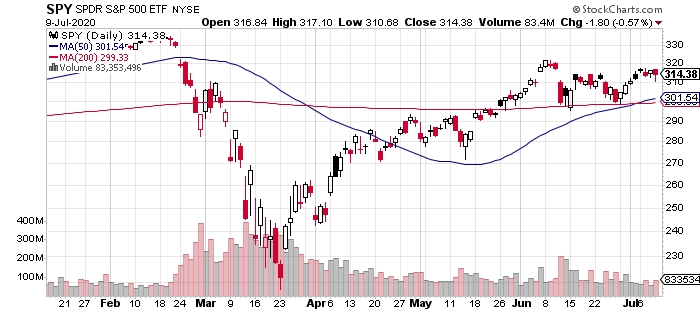
SPY Daily Chart

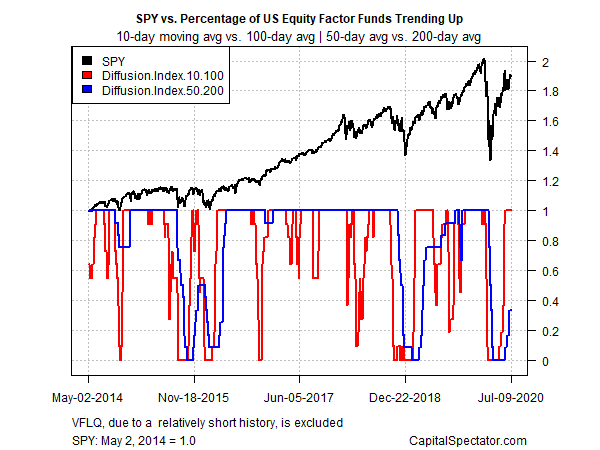
Profiling the factor ETFs listed above continues to show a strong rebound in the short-term trend bias for all the funds. By contrast, the medium-term trend is still struggling to recover from the previous correction. This profile is based on two sets of moving averages. The first measure compares the 10-day average with its 100-day counterpart — a proxy for short-term trending behavior (red line in chart below). A second set of moving averages (50 and 200 days) represent an intermediate measure of the trend (blue line). The key question: Will the relatively weak medium-term trend indicator confirm the bullish shift in the short-term profile?
3rd party Ad. Not an offer or recommendation by Investing.com. See disclosure here or remove ads .

SPY Vs US Equity Factor Funds - Diffusion Index

Latest comments

Risk Disclosure: Trading in financial instruments and/or cryptocurrencies involves high risks including the risk of losing some, or all, of your investment amount, and may not be suitable for all investors. Prices of cryptocurrencies are extremely volatile and may be affected by external factors such as financial, regulatory or political events. Trading on margin increases the financial risks.
Before deciding to trade in financial instrument or cryptocurrencies you should be fully informed of the risks and costs associated with trading the financial markets, carefully consider your investment objectives, level of experience, and risk appetite, and seek professional advice where needed.
Fusion Media would like to remind you that the data contained in this website is not necessarily real-time nor accurate. The data and prices on the website are not necessarily provided by any market or exchange, but may be provided by market makers, and so prices may not be accurate and may differ from the actual price at any given market, meaning prices are indicative and not appropriate for trading purposes. Fusion Media and any provider of the data contained in this website will not accept liability for any loss or damage as a result of your trading, or your reliance on the information contained within this website.
It is prohibited to use, store, reproduce, display, modify, transmit or distribute the data contained in this website without the explicit prior written permission of Fusion Media and/or the data provider. All intellectual property rights are reserved by the providers and/or the exchange providing the data contained in this website.
Fusion Media may be compensated by the advertisers that appear on the website, based on your interaction with the advertisements or advertisers.
© 2007-2024 - Fusion Media Limited. All Rights Reserved.