Four in a row. That’s how many consecutive 3-point baskets Andre Iguodala scored against the Houston Rockets in Monday night’s playoff game.
There has also been a “4 for 4″ in the financial markets. One after another, major banks have lowered their year-end targets for the S&P 500. Most recently, the global equity team at HSBC shaved its year-end target to 2,050 from 2,100.
On the surface, HSBC’s cut is less severe than other bank revisions to S&P 500 estimates. That said, J.P Morgan (NYSE:JPM) pulled its projection all the way down from 2200 to 2000. Credit Suisse (NYSE:CS)? Down to 2,050 from 2,200. And Morgan Stanley (NYSE:MS) slashed its year-end projection from 2175 to 2050.
So what’s going on? We had four influential banks expressing confidence in the popular benchmark a few months earlier. Their analysts originally projected total returns with reinvested dividends between 5%-10% in the present 12-month period. Now, however, with the S&P 500 only expected to finish between 2000-2050, these banks see the index offering a paltry 0%-2%. Another way some have phrased it? Excluding dividends, there is “zero upside.”
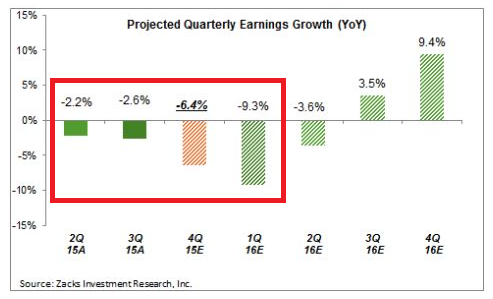
Here is yet another “4 for 4″ that makes a number of analysts uncomfortable. Year-over-year quarterly earnings have fallen four consecutive times. That has not happened since the Great Recession. And revenue? Corporations have put forward year-over-year declines in sales growth for five consecutive quarters. That hasn’t happened since the Great Recession either.
The bullish investor case is that the trend is going to start reversing itself in the 2nd half of 2016. However, forward estimates of earnings growth and revenue growth are routinely lowered so that two-thirds or more companies can surpass “expectations.” And it is not unusual for estimates to be lowered by 10%. Take Q1. Shortly before the start of the year, Q1 estimates had been forecast to come in at a mild gain. Today? We’re looking at -9% or worse for Q1.
Over the previous five years, Forward P/Es averaged 14.5. They now average 16.5 on earning estimates that will never be realized. In essence, S&P 500 stock prices are sitting a softball’s throw away from an all-time record (2130), while the forward P/E valuations sit at bull market extremes that do not justify additional appreciation in price.
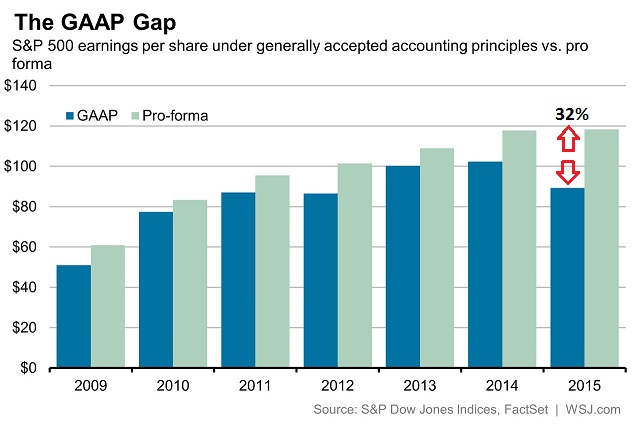
And what about earnings quality? Wall Street typically presents two kinds: Generally Accepted Accounting Principles (GAAP) earnings and non-GAAP earnings that excludes special items, non-recurring expenses and a wide variety on “one-time charges.” The foolishness of non-GAAP presentations notwithstanding, one might disregard the manipulation when non-GAAP and GAAP are within the usual 10% range. This was more or less the case between 2009 and 2013. By 2014, however, the gap between the two different earnings per share reports began to widen. By 2015, “manipulated” pro forma ex-items earnings exceeded actual earnings per share by roughly $250 billion, or 32%. Can you spell c-h-i-c-a-n-e-r-y?
Of particular interest, there was a similar disconnect between GAAP and non-GAAP in 2007. Non-GAAP in the year when the last bear market began (10/07) was 24% higher than GAAP earnings per share. It follows that the discrepancy today in earnings quality is even wider than it was prior to the stock market collapse.
“But Gary,” you protest. “As long as the Federal Reserve and central banks are exceptionally accommodating, stocks should excel.” In truth, however, the long-term relationship between the S&P 500 SPDR Trust (SPY (NYSE:SPY)) and the Vanguard Total Bond Market ETF (NYSE:BND) demonstrate that the bond component of one’s portfolio has been more productive over the last 12 months than the stock component.
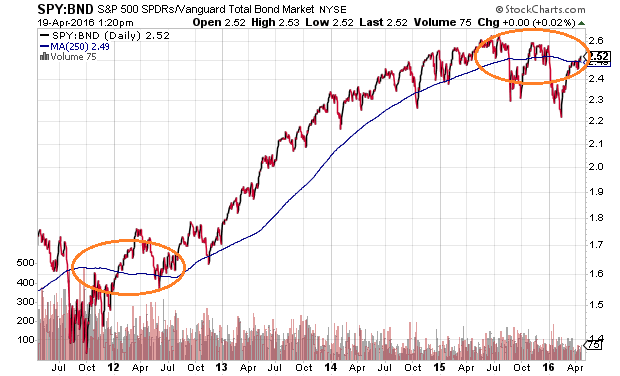
Bulls can point to the market’s eventual ability to shake off the euro-zone crisis of 2011. That was the last time that the SPY:BND price ratio struggled for an extended length of time. Back then, however, the Federal Reserve offered two aggressive easing policies – “Operation Twist” and “QE 3.” Today? Stocks are not only extremely overvalued on most historical measures, but the Fed has only lowered its tightening guidance from four hikes down to two hikes. Is that really enough ammunition to power stocks to remarkable new heights?
“Okay,” you acknowledge. “But rates are so low, they are even lower than they were in 2013. And that means, going forward, there is no alternative to stocks.”
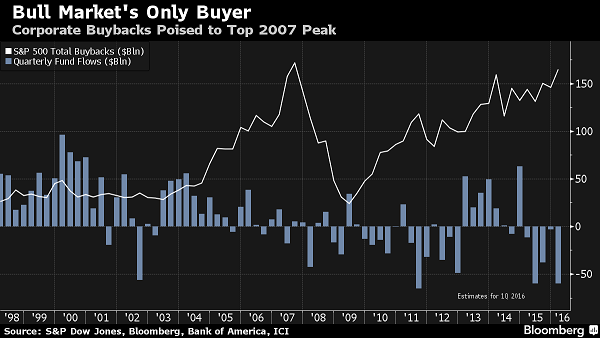
Not only does history dispel the myth that there are no alternatives to stocks, but many corporations that have been buying back their stocks at attractive borrowing costs are now at risk of debt downgrades, higher interest expenses and even default. For example, the moving 12-month sum of Moody’s debt downgrades hopped from 32 a year ago to 61 in March of 2016. Meanwhile, the longer-term trend for the widening of credit spreads between investment grade treasuries in iShares 7-10 Year Treasury (NYSE:IEF) and high yield bonds in iShares High Yield Corporate Bond (NYSE:HYG) suggests that the corporate debt binge may soon come to an ignominious end.
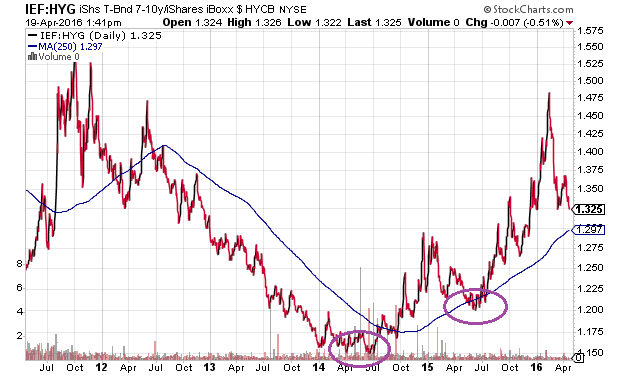
Foreign stocks, emerging market stocks as well as high yield bonds all hit their cyclical tops in mid-2014, when the credit spreads were remarkably narrow. The IEF:HYG price ratio spikes and breakdowns notwithstanding, the general trend for 18-plus months has been less favorable to lower-rated corporate borrowers.
The implication? With corporate credit conditions worsening at the fastest pace since the financial crisis, companies may be forced to slow or abandon stock share buybacks. What group of buyers will pick up the slack when valuation extremes meet fewer stock buybacks?

