
L Brands, Inc. (NYSE:LB) is scheduled to release first-quarter fiscal 2019 results on May 22, after the market closes. We note that in the trailing four quarters, this specialty retailer of women’s intimate and other apparel, beauty, and personal care products outperformed the Zacks Consensus Estimate, recording average positive earnings surprise of 7.3%. In the last quarter, the company delivered a positive earnings surprise of 3.4%. Let’s see what awaits this quarterly release.
How are Estimates Faring?
The Zacks Consensus Estimate for the first quarter is pegged at break-even, reflecting a significant decline from earnings of 17 cents reported in the year-ago quarter. Notably, the consensus mark has been stable in the past 30 days. For revenues, the consensus estimate stands at $2,557 million, down 2.6% from the year-ago quarter’s figure.
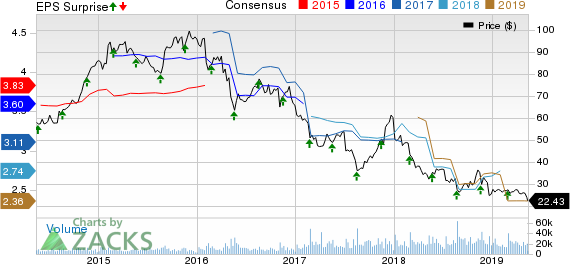
L Brands, Inc. Price, Consensus and EPS Surprise
Factors at Play
L Brands’ Victoria’s Secret brand has been witnessing soft sales for quite some time now, stemming from stiff competition and consumers’ changing preferences. These trends may linger and hit the top line in the quarter under review. Incidentally, management had earlier provided a soft guidance for first-quarter fiscal 2019. The company anticipates first-quarter comparable sales to fall in low-single digits. Total sales growth is expected to be roughly 1 point lower than comparable sales growth. This can be attributed to loss of La Senza and Henri Bendel sales.
Also, the company is grappling with strained margins for the past few quarters. Reduction in merchandise margin rate and higher occupancy costs led to gross margin decline in the previous quarter. Moreover, gross margin rate is likely to decrease in fiscal 2019, mainly due to lower merchandise margins. SG&A costs are expected to increase year over year, stemming from higher wage rate and inflation-related pressure. This in turn raises concerns for the quarter to be reported. For the said period, the company expects breakeven earnings compared with 17 cents in the year-ago period.
Nevertheless, L Brands’ remains focused on cost containment, inventory management, and merchandise and speed-to-market initiatives. Also, its focus on tapping international markets is likely to offer some cushion. The company has relaunched Victoria Secret’s swimwear category which is likely to boost traffic. Apart from these, it has been benefitting from strength of its Bath & Body Works or BBW brand. Notably, sales of the BBW brand have been rising year over year for more than two quarters now. We expect the trend to continue in the impending quarter and offer some respite to the company.
What Our Model Says
Our proven model does not conclusively show that L Brands is likely to beat estimates this quarter. This is because a stock needs to have both — a Zacks Rank #1 (Strong Buy), 2 (Buy) or 3 (Hold) and a positive Earnings ESP — for this to happen. You can uncover the best stocks to buy or sell before they’re reported with our Earnings ESP Filter. You can see the complete list of today’s Zacks #1 Rank stocks here.
Though L Brands has a Zacks Rank #3, its Earnings ESP of 0.00% makes surprise prediction difficult.
Stocks With Favorable Combination
Here are some companies you may want to consider as our model shows that these have the right combination of elements to post earnings beat.
Boot Barn Holdings, Inc. (NYSE:BOOT) has an Earnings ESP of +2.62% and a Zacks Rank #2.
Target Corporation (NYSE:TGT) has an Earnings ESP of +0.42% and a Zacks Rank #2.
Dollar General (NYSE:DG) has an Earnings ESP of +1.51% and a Zacks Rank #3.
Today's Best Stocks from Zacks
Would you like to see the updated picks from our best market-beating strategies? From 2017 through 2018, while the S&P 500 gained +15.8%, five of our screens returned +38.0%, +61.3%, +61.6%, +68.1%, and +98.3%.
This outperformance has not just been a recent phenomenon. From 2000 – 2018, while the S&P averaged +4.8% per year, our top strategies averaged up to +56.2% per year.
See their latest picks free >>
L Brands, Inc. (LB): Free Stock Analysis Report
Dollar General Corporation (DG): Free Stock Analysis Report
Target Corporation (TGT): Free Stock Analysis Report
Boot Barn Holdings, Inc. (BOOT): Free Stock Analysis Report
Original post
Zacks Investment Research