In a recent note by Jeff Saut at Raymond James, he noted that valuations are cheap based on forward earnings estimates. Here is what he said:
"That said, valuations are not particularly onerous with the P/E ratio for the S&P 500 (SPX/1841.13) currently trading around 15.2x this year’s bottom-up estimate of roughly $121 per share. Moreover, if next year’s estimates are anywhere near the mark of $137, the SPX is being valued at a mere 13.4x earnings."
As a reminder, it is important to remember that when discussing valuations, particularly regarding historic over/under valuation, it is ALWAYS based on trailing REPORTED earnings. This is what is actually sitting on the bottom line of corporate income statements versus operating earnings, which is "what I would have earned if XYZ hadn't happened."
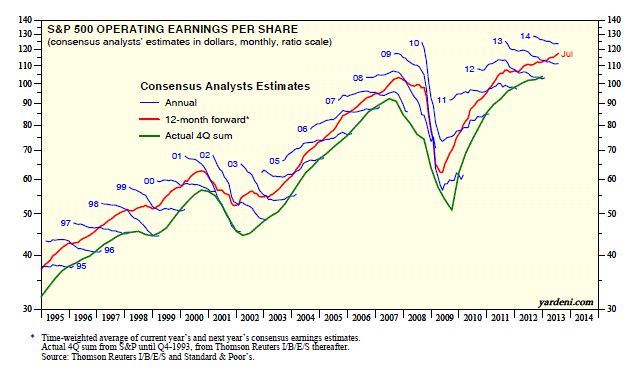
Beginning in the late 90's, as the Wall Street casino opened its doors to the mass retail public, use of forward operating earning estimates to justify extremely overvalued markets came into vogue. However, the problem with forward operating earning estimates is that they are historically wrong by an average of 33%. The chart below, courtesy of Ed Yardeni, shows this clearly.
Let me give you a real time example of what I mean. At the beginning of the year, the value of the S&P 500 was roughly 1850, which is about where it was at the end of last week. In January, forward operating earnings for 2014 were expected to be $121.45 per share. This gave the S&P 500 a P/FE (forward earnings) ratio of 15.23x.
Already forward operating earnings estimates have been reduced to $120.34 for 2014. If we use the same price level as in January - the P/FE ratio has already climbed 15.37x.
Let's take this exercise one step further and consider the historical overstatement average of 33%. However, let's be generous and assume that estimates are only overstated by just 15%. Currently, S&P is estimating that earnings for the broad market index will be, as stated above, $120.34 per share in 2014 but will rise by 14% in 2015 to $137.36 per share. If we reduce both of these numbers by just 15% to account for overly optimistic assumptions, then the undervaluation story becomes much less evident. Assuming that the price of the market remains constant the current P/FE ratios rise to 18.08x for 2014 and 15.84x for 2015.
Of course, it is all just fun with numbers and, as I stated yesterday, this there are only three types of lies:
"Lies, Damned Lies and Statistics."
With the continued changes to accounting rules, repeal of FASB rule 157, and the ongoing torturing of income statements by corporations over the last 25 years in particular, the truth between real and artificial earnings per share has grown ever wider. As I stated recently in "50% Profit Growth:"
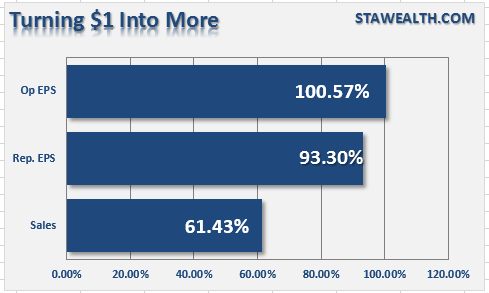
"The sustainability of corporate profits is dependent on two primary factors; sustained revenue growth and cost controls. From each dollar of sales is subtracted the operating costs of the business to achieve net profitability. The chart below shows the percentage change of sales, what happens at the top line of the income statement, as compared to actual earnings (reported and operating) growth."
"Since 2000, each dollar of gross sales has been increased into more than $1 in operating and reported profits through financial engineering and cost suppression. The next chart shows that the surge in corporate profitability in recent years is a result of a consistent reduction of both employment and wage growth. This has been achieved by increases in productivity, technology and offshoring of labor. However, it is important to note that benefits from such actions are finite."
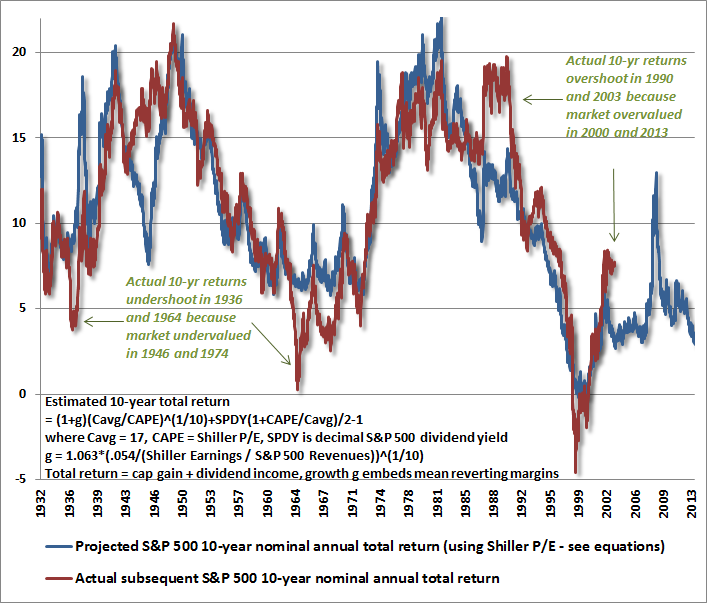
This is why trailing reported earnings is the only "honest" way to approach valuing the markets. Bill Hester recently wrote a very good note in this regard in response to critics of Shiller's CAPE (cyclically-adjusted price/earnings) ratio which smoothes trailing reported earnings.
"More recently the ratio has undergone an attack from some widely-followed analysts, questioning its validity and offering up attempts to adjust the ratio. This may be a reaction to its new-found notoriety, but more likely it’s because the CAPE is suggesting that US stocks are significantly overvalued. All of the adjustments analysts have made so far imply that stocks are less overvalued than the traditional CAPE would suggest."
We feel no particular obligation defend the CAPE ratio. It has a strong long-term relationship to subsequent 10-year market returns. And it’s only one of numerous valuation indicators that we use in our work – many which are considerably more reliable. All of these valuation indicators – particularly when record-high profit margins are accounted for – are sending the same message: The market is steeply overvalued, leaving investors with the prospect of low, single-digit long-term expected returns. But we decided to come to the aid of the CAPE ratio in this case because a few errors have slipped into the debate, and it’s important for investors who have previously relied on this ratio to understand these errors so they can judge the valuation metric fairly. Importantly, the primary error that is being made is not even the fault of those making the arguments against the CAPE ratio. The fault lies at the feet of a misleading data series."
If I want to justify selling you an overvalued mutual fund or equity, then I certainly would try to find ways to discount measures which suggest investments made at current levels will likely have low to negative future returns. However, as a money manager for individuals in retirement, my bigger concern is protecting investment capital first. (Note: that statement does not mean that I am currently in cash, we are fully invested at the current time. However, we are not naive about the risks to our holdings.)
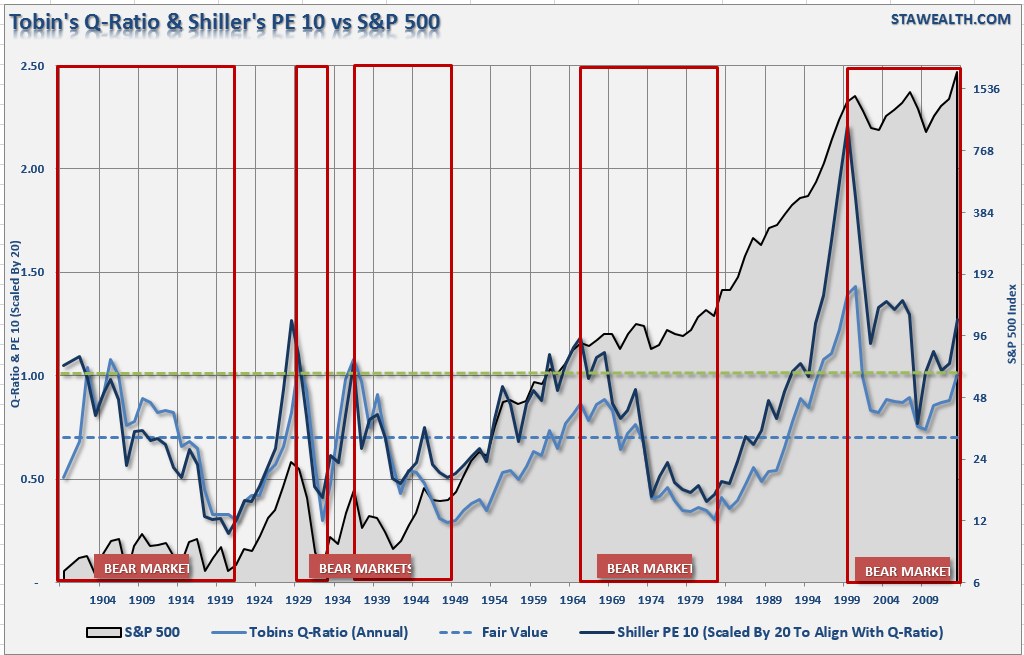
The following chart shows Tobin's "Q" ratio and Robert Shillers "Cyclically Adjusted P/E (CAPE)" ratio versus the S&P 500. James Tobin of Yale University, Nobel laureate in economics, hypothesized that the combined market value of all the companies on the stock market should be about equal to their replacement costs. The Q ratio is calculated as the market value of a company divided by the replacement value of the firm's assets. Currently, the CAPE is at 25.41x, and the Q-ratio is at 1.01.
Both of these measures are currently at levels that suggest that forward stock market returns are likely to be in the low to single digits over the next decade. However, it is always at the point of peak valuations where the search for creative justification begins. Unfortunately, it has never "been different this time."
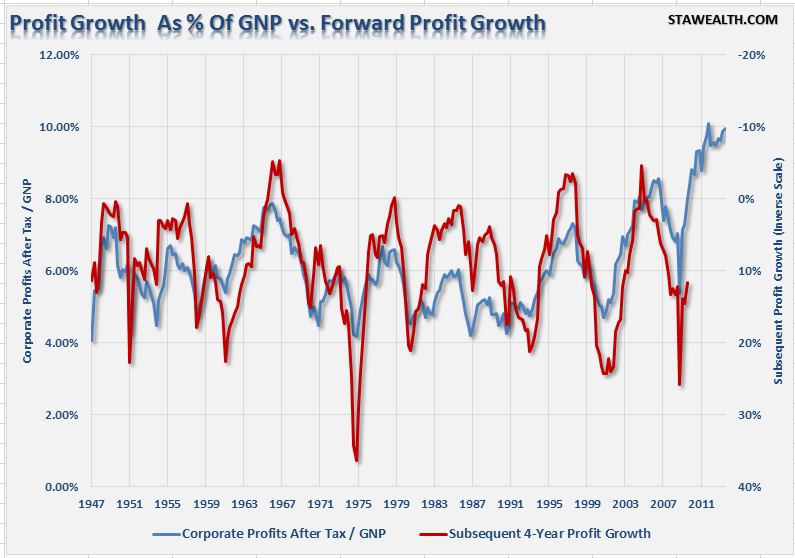
Lastly, with corporate profits at record levels relative to economic growth, it is likely that the current robust expectations for continued double digit margin expansions will likely turn out to be somewhat disappointing.
As we know repeatedly from history, extrapolated projections rarely happen. Therefore, when analysts value the market as if current profits are representative of an indefinite future, they have likely insured investors will receive a very rude awakening at some point in the future.
There is mounting evidence, from valuations being paid in M&A deals, junk bond yields, margin debt and price extensions from long term means, "exuberance" is once again returning to the financial markets. Again, as I stated previously, my firm remains fully invested in the markets at the current time. I write this article, not from a position of being "bearish" as all such commentary tends to be classified, but from a position of being aware of the "risk" that could potentially damage long term returns to my clients. It is always interesting that, following two major bear markets, investors have forgotten that it was these very same analysts that had them buying into the market peaks previously.

