
Kinross Gold Corporation (NYSE:KGC) reported net profit of $217.6 million or 17 cents per share in fourth-quarter 2017, as against a net loss of $116.5 million or 9 cents recorded in the year-ago quarter. 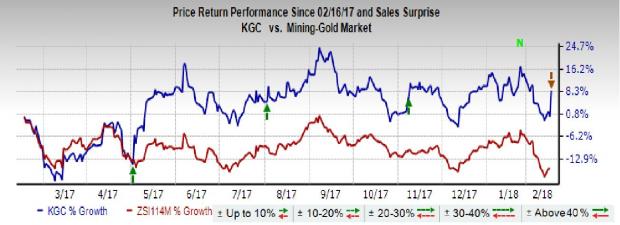
Methanex Corporation (MEOH): Free Stock Analysis Report
Cabot Corporation (CBT): Free Stock Analysis Report
LyondellBasell Industries NV (LYB): Free Stock Analysis Report
Kinross Gold Corporation (KGC): Free Stock Analysis Report
Original post
Zacks Investment Research
The company’s adjusted earnings (excluding one-time items) were $16.3 million or a penny per share, as against an adjusted loss of $50.9 million or 4 cents recorded a year-ago. Earnings per share lagged the Zacks Consensus Estimate of 4 cents.
Revenues of $810.3 million in the quarter fell around 10.2% from $902.8 million recorded in the year-ago quarter owing to lower gold equivalent ounces sold, partly offset by higher average realized gold price. Revenues missed the Zacks Consensus Estimate of $853 million.
Full-Year 2017 Results
For 2017, the company posted profits of $445.4 million or 36 cents per share, as against a net loss of $104 million or 8 cents a year ago. Adjusted earnings for the same period were $178.7 million or 14 cents per share, up 92.2% from $93 million or 8 cents reported in 2016.
Additionally, Kinross reported revenues of $3.3 billion in 2017, down around 4.9% from $3.5 billion in 2016.
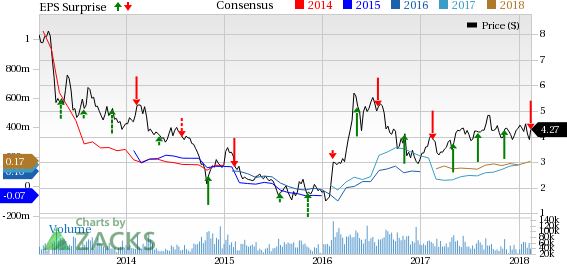
Kinross Gold Corporation Price, Consensus and EPS Surprise
Operational Performance
Attributable gold production was 652,710 ounces for the quarter, down 12.5% year over year. Production cost of sales per gold equivalent ounce declined to $653 from $712 recorded in the prior-year quarter, mainly due to lower cost of sales per ounce at Tasiast, Fort Knox and Bald Mountain. All-in sustaining cost per gold equivalent ounce sold rose to $1,019 from $1,012 a year ago.
Margin per gold equivalent ounce sold was $623 in the quarter, up from $505 a year ago.
Average realized gold prices was $1,276 per ounce in the quarter, up 4.8% from $1,217 a year ago.
Financial Review
Adjusted operating cash flow was $364.2 million for the quarter, increasing from $211.6 million in the prior-year quarter. Cash and cash equivalents were $1,025.8 million as of Dec 31, 2017, up from $827 million as of Dec 31, 2016.
Long-term debt was essentially flat year over year at $1,732.6 million and there are no scheduled debt repayments due for the company until 2021.
Capital expenditures rose to $313.3 million in the quarter from $226.5 million in the prior-year quarter owing to increased spending at Tasiast, Bald Mountain and Round Mountain.
Development Updates
Kinross announced that it is proceeding with the Round Mountain Phase W and Bald Mountain Vantage projects in Nevada. Kinross continues to progress with the Phase One expansion of the Tasiast mine and remains on track with its full commercial production, which is anticipated to begin by the end of June 2018. Also, the company expects to speed up the construction of Tasiast Phase Two.
The company expects to commence mining of high-grade ore at Moroshka in Russia. The Fort Knox Gilmore feasibility study and pre-feasibility study at Tasiast Sud are expected to be completed in 2018.
Outlook
For 2018, Kinross expects gold production of 2.5 million gold equivalent ounces. Production cost of sales for the year has been forecast at $730 per gold equivalent ounce. All-in sustaining cost is expected to be $975 per gold equivalent ounce.
Kinross sees capital expenditure of roughly $1,075 million (+/- 5%) for 2018.
Price Performance
Shares of Kinross have moved up 8.7% over a year, outperforming the 15.7% decline recorded by its industry.
Zacks Rank & Stocks to Consider
Kinross currently carries a Zacks Rank #3 (Hold).
Some better-ranked stocks in the basic materials space are Methanex Corporation (NASDAQ:MEOH) , LyondellBasell Industries N.V. (NYSE:LYB) and Cabot Corporation (NYSE:CBT) . All three stocks sport a Zacks Rank #1 (Strong Buy). You can see the complete list of today’s Zacks #1 Rank stocks here.
Methanex has an expected long-term earnings growth rate of 15%. Its shares have rallied 12.8% over a year.
LyondellBasell has an expected long-term earnings growth rate of 9%. The company’s shares have gained 17.8% in a year.
Cabot has an expected long-term earnings growth rate of 10%. Its shares have moved up 12.4% over a year.
The Hottest Tech Mega-Trend of All
Last year, it generated $8 billion in global revenues. By 2020, it's predicted to blast through the roof to $47 billion. Famed investor Mark Cuban says it will produce "the world's first trillionaires," but that should still leave plenty of money for regular investors who make the right trades early.
Methanex Corporation (MEOH): Free Stock Analysis Report
Cabot Corporation (CBT): Free Stock Analysis Report
LyondellBasell Industries NV (LYB): Free Stock Analysis Report
Kinross Gold Corporation (KGC): Free Stock Analysis Report
Original post
Zacks Investment Research