
What about Japanese government bonds? The closing yield on the day the Nikkei hit its interim low on November 25, 2011 was 1.53%. While the index is up 73.8%, the 10-year yield has plunged to 0.59%.
Here's a quick review of the Nikkei 225, the 10-year bond and inflation over the past few decades.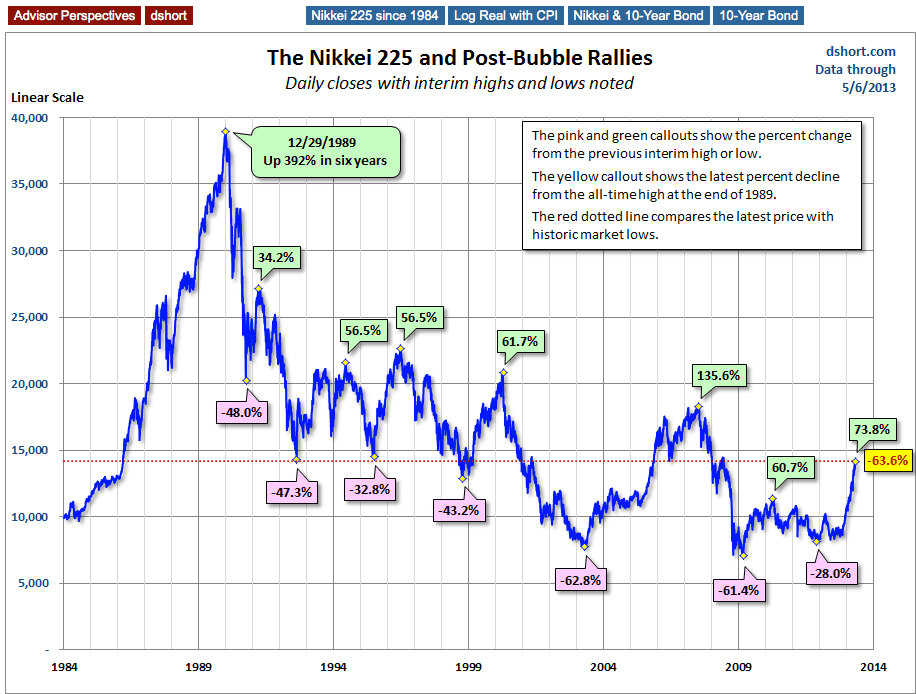
The table below documents the advances and declines and the elapsed time for the major cycles in the Nikkei.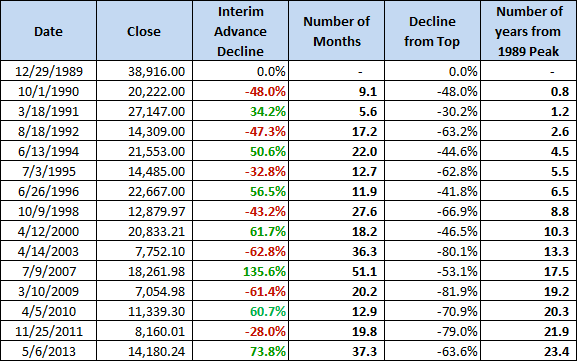
The Nominal vs. Real Nikkei 225
For most major indexes, we expect to see a significant difference between the nominal and real price over a multi-decade timeframe. But Japan's chronic bouts of deflation have kept the two metrics rather tight. Note that I've used a log vertical axis for the index price to better illustrate the relative price changes over time.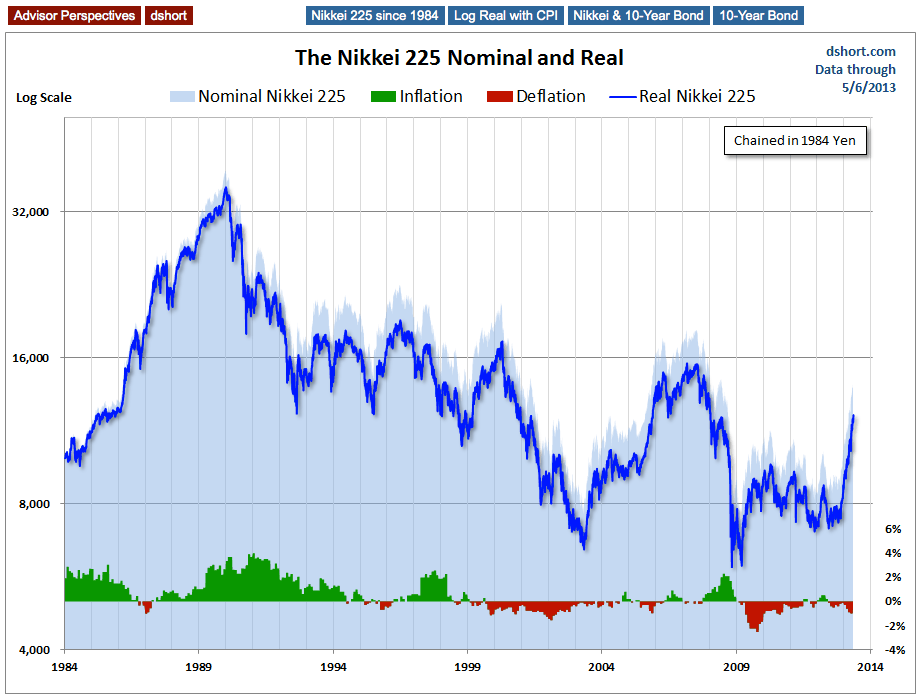
Japanese Bond Yields: How Low Can They Go?
Government bond yields in many safe-haven countries have plunged since the Financial Crisis, although the US 10-year, now hovering around 1.7 to 1.8 percent, is off its historic closing low of 1.43 percent set in July of last year. The lesson from Japan is that the trend toward lower yields can last a very long time. Here is an overlay of the nominal Nikkei (linear scale) and the 10-year bond along with Japan's official discount rate. The 10-year yield hit its all-time low in June of 2013, about 10 years ago, at 0.43%. It closed yesterday at 0.59%.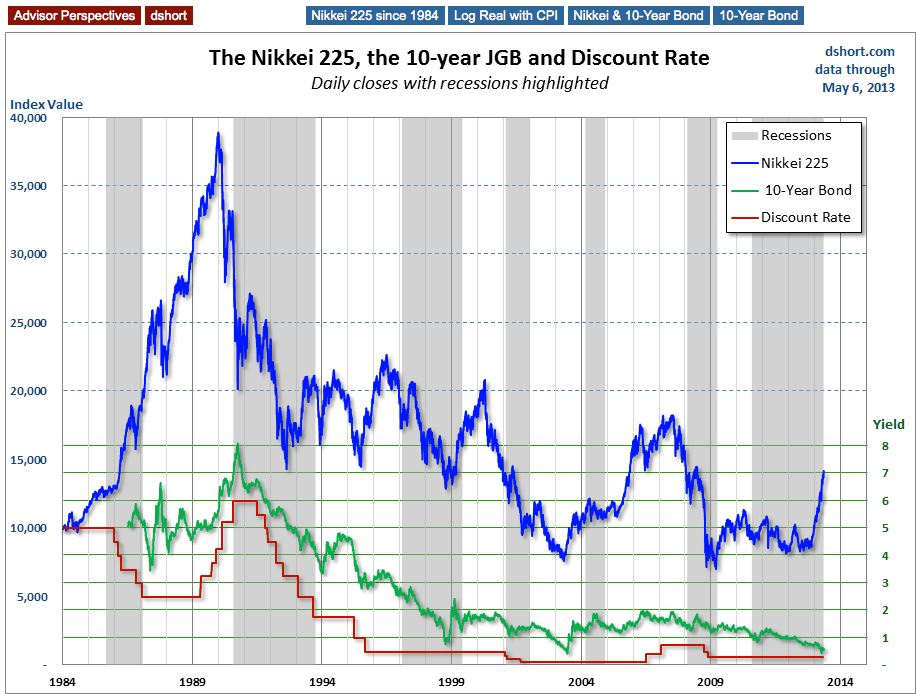
And here is a closer look at the 10-year yield over time (linear scale).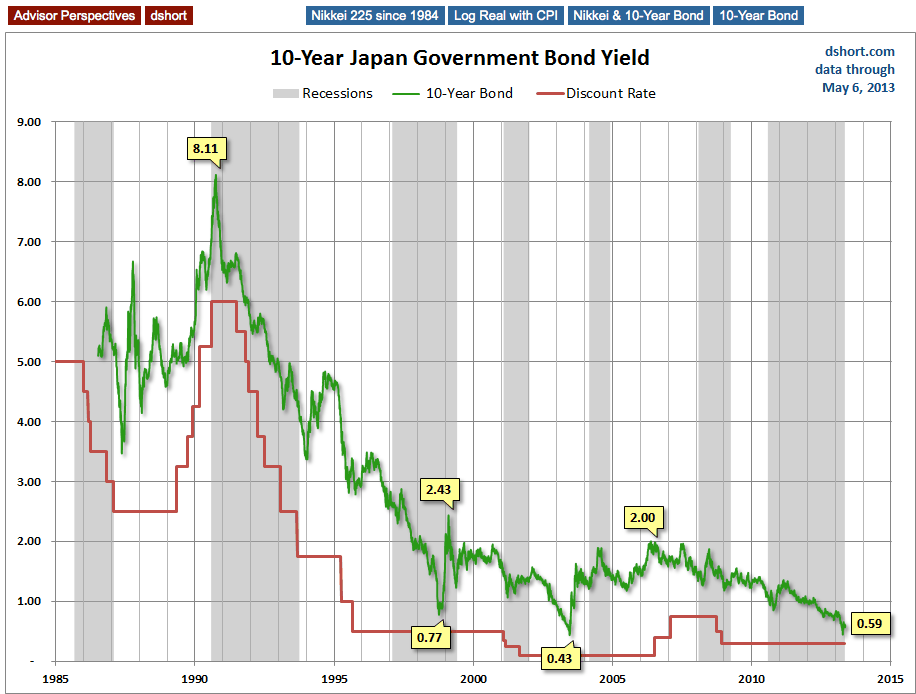
I mentioned that 10-year record low of 0.43%. When the latest round of BoJ easing was officially announced on April 4, the yield closed that day at 0.45 percent.
The consensus view of the Nikkei's massive rally since last November, and certainly one that I share, is that it is essentially a result of the market's response to rumors and news of the BoJ's plan for the latest easing of last resort months before its implementation, with the falling Yen as the key driver.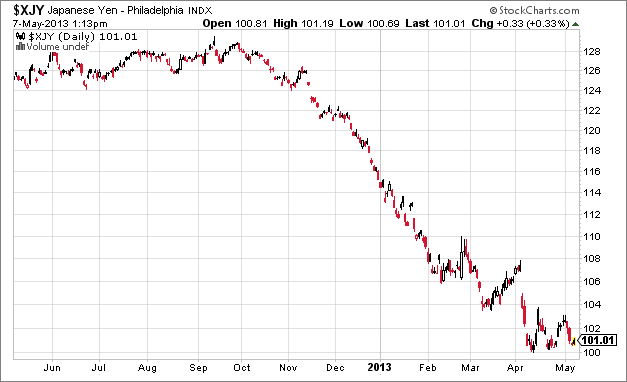
Interestingly enough, today Japan's finance minister, in typical fashion, distanced monetary policy from market performance.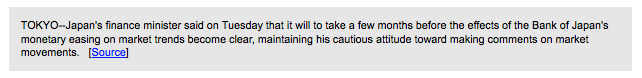
What we're seeing in Japan is a new chapter in an amazing drama of economics and the market -- one that will no doubt have additional chapters of interest in the not-to-distant future.
Note: The "recessions" highlighted in the third chart above are based on the OECD Composite Leading Indicators Reference Turning Points and Component Series. I use the peak-to-trough version of data (peak month begins the gray, trough month is excluded), which is conveniently available in the FRED repository. As we can readily see, the OECD concept of turning points is much broader than the method used by the NBER to define recessions in the US.
- English (UK)
- English (India)
- English (Canada)
- English (Australia)
- English (South Africa)
- English (Philippines)
- English (Nigeria)
- Deutsch
- Español (España)
- Español (México)
- Français
- Italiano
- Nederlands
- Português (Portugal)
- Polski
- Português (Brasil)
- Русский
- Türkçe
- العربية
- Ελληνικά
- Svenska
- Suomi
- עברית
- 日本語
- 한국어
- 简体中文
- 繁體中文
- Bahasa Indonesia
- Bahasa Melayu
- ไทย
- Tiếng Việt
- हिंदी
Japan's Amazing Market Drama
Published 05/07/2013, 03:11 PM
Updated 07/09/2023, 06:31 AM
Japan's Amazing Market Drama
Note from dshort: Japan's Nikkei 225 has been on a tear of late and is now up 73.8% from its interim low in November of 2011. Its Monday gain of 3.55% puts the index up 36.41% in 2013. After months of discussion and press speculation, last month the Bank of Japan disclosed its radical redo of monetary policy. The index is up 14.71% since the day before the unveiling on April 4.
Latest comments
Loading next article…
Install Our App
Risk Disclosure: Trading in financial instruments and/or cryptocurrencies involves high risks including the risk of losing some, or all, of your investment amount, and may not be suitable for all investors. Prices of cryptocurrencies are extremely volatile and may be affected by external factors such as financial, regulatory or political events. Trading on margin increases the financial risks.
Before deciding to trade in financial instrument or cryptocurrencies you should be fully informed of the risks and costs associated with trading the financial markets, carefully consider your investment objectives, level of experience, and risk appetite, and seek professional advice where needed.
Fusion Media would like to remind you that the data contained in this website is not necessarily real-time nor accurate. The data and prices on the website are not necessarily provided by any market or exchange, but may be provided by market makers, and so prices may not be accurate and may differ from the actual price at any given market, meaning prices are indicative and not appropriate for trading purposes. Fusion Media and any provider of the data contained in this website will not accept liability for any loss or damage as a result of your trading, or your reliance on the information contained within this website.
It is prohibited to use, store, reproduce, display, modify, transmit or distribute the data contained in this website without the explicit prior written permission of Fusion Media and/or the data provider. All intellectual property rights are reserved by the providers and/or the exchange providing the data contained in this website.
Fusion Media may be compensated by the advertisers that appear on the website, based on your interaction with the advertisements or advertisers.
© 2007-2024 - Fusion Media Limited. All Rights Reserved.