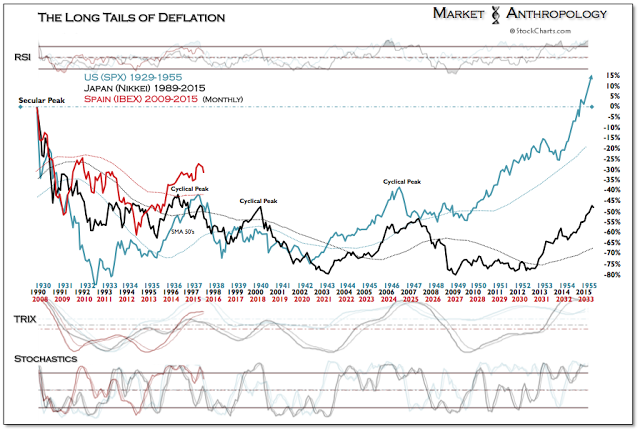
In what gradually became practically an anything but US equities market approach for us, Japan's Nikkei succeeded in strongly outperforming the S&P 500 in the first half of the year; rising just under 16 percent - while the SPX barely remained in positive territory (0.20%) for 2015.
Along with China's Shanghai Composite Index, the Nikkei remained one of our preferred equity markets going into the year, with expectations that Japan was breaking free of the long tentacles of deflation that had constricted their economy and constrained its equity markets over the past twenty-five years.
On average, a quarter century is the generally accepted length by historians between generations. From the birth of a parent to the birth of a child, the time span can encompass profound behavioral changes within society, many times greatly affected by shifts in economic prosperity or hardship. And while Japan's experience with perennial deflation and economic contraction was in fact much less austere than what the US experienced in the 1930s and early 1940s, similar to the US generation born during the Great Depression and World War II, historians might ironically refer to those brought up in Japan over the previous two decades as the "Lucky Few" as well.
Over the past two years we've followed the Nikkei in relation to the US equity markets across the 1930s to 1950s (see here), with expectations that despite a more protracted regression decline in the Nikkei - would result with a similar equity market rebound (see here & here) as deflationary conditions subsided in its third decade since its secular peak in December 1989.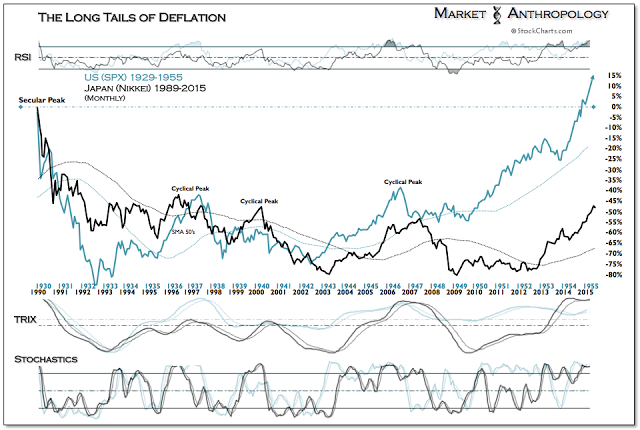
Both the SPX and the Nikkei contracted ~80 percent below their secular peaks. However, in the US, the equity market collapse was acute and reached a cycle low less than three years from the 1929 high. For Japan, the contraction was more gradual - reaching a secular low ~20 years from its 1989 high. One could argue that this difference reflected the broader influence the asset declines had on each society, with the more severe decline profoundly impacting the US through the Great Depression.
That said, it's interesting to note that from a patterned perspective, by pivoting the performance regression trend of the Nikkei (~14 degrees) to the SPX, the respective cycles within the span correspond. 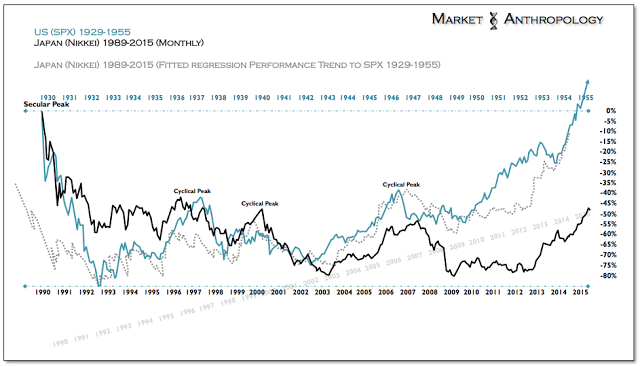
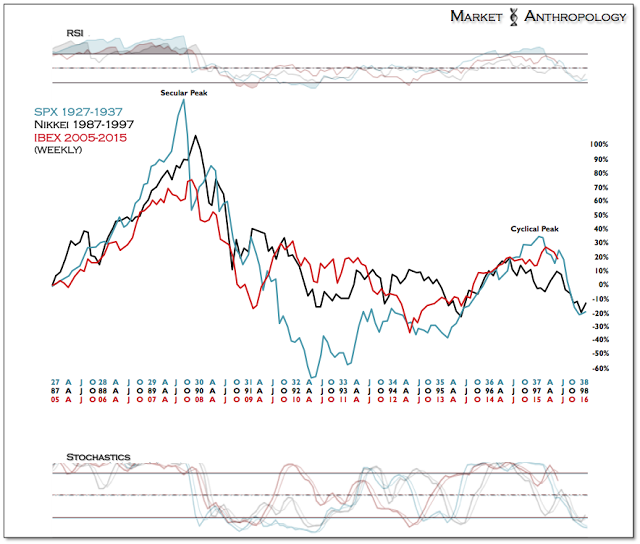
Another pattern we've followed in the Nikkei over the past two years - and one that guided our expectations from the relative performance extreme reached at the end of 2013 - extends from the long-term trend line resistance that begins as well at a relative performance extreme in 1987.
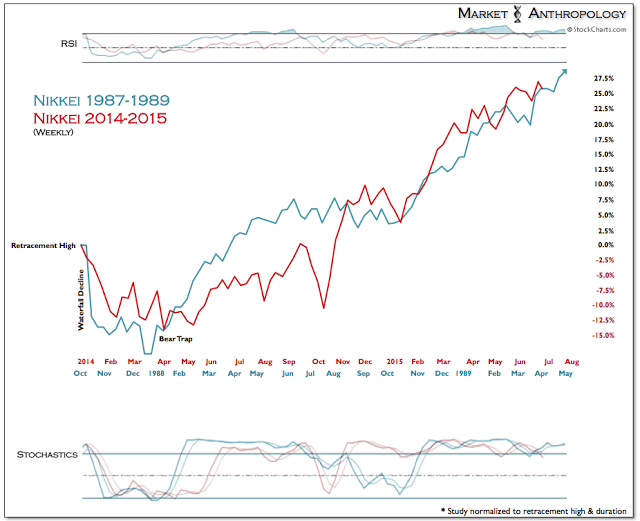
Overall, the Nikkei continues to follow the performance trace from the 1987 retracement decline - a pattern trajectory we expect it will continue to loosely hold this year. 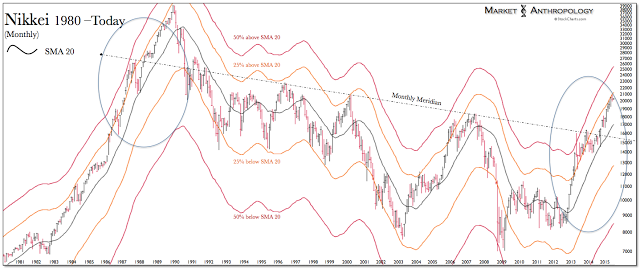
In what has increasingly become en vogue for investors today, participants have flocked to novel currency hedged ETFs - such as Wisdom Tree's Japan Hedged Equity ETF (NYSE:DXJ), that offers equity exposure to Japan, while at the same time hedging fluctuations between the value of the US dollar and yen.
While these funds strongly outperformed non-hedged ETFs in 2014, their out-performance has been attenuating in the first half of this year. We maintain the expectation that a trend change is afoot in the yen/Nikkei relationship, which would reverse the prolonged inverse correlation extreme that's been in place since Abenomics was introduced at the end of 2012 - and shifts the equity hedge, in our opinion, in favor of a stronger yen.
The BOJ's Kuroda would appear to agree. 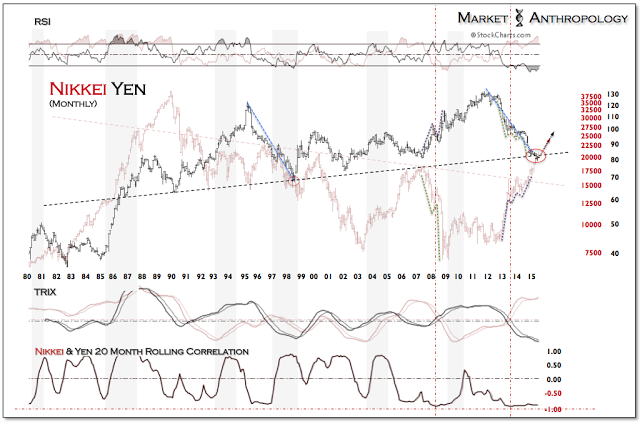
With another bitter milestone approaching for Greece and Europe this weekend, we'd feel remiss in not mentioning once again the fragility of where some of the key peripheral markets such as Spain's IBEX are trading across this year - in relation to our Long Tails of Deflation performance series.
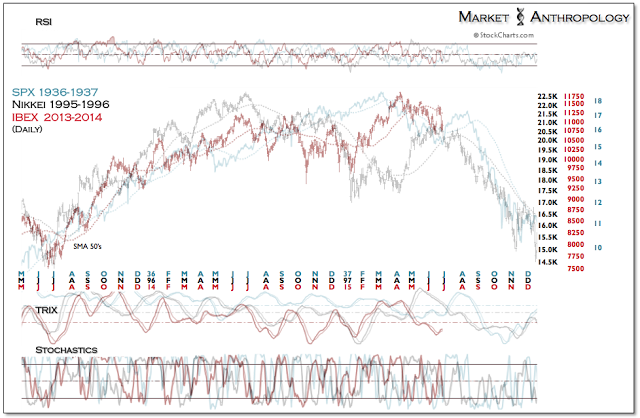
As mentioned in previous notes, from a comparative perspective - you could argue that what the ECB is attempting to avoid with its more aggressive policy pivot this year are the missteps that were compounded by each central bank in their respective cycles; both by the Fed in late 1936 into early 1937 and the BOJ in 1997. In both occurrences, the powers that be worsened economic conditions by tightening monetary and fiscal policy, where they very likely should have eased.
With the referendum vote on deck this Sunday in Greece, it's no coincidence that the ECB late last week (see here) added corporate debt to the list of assets eligible for purchase under its new QE program. And while the ECB's bazooka would help mitigate the fallout in the debt markets should conditions in Greece remain or worsen, we would still approach the lack of compromise and resolution that currently exists between Greece and the EU as a broader failure and policy misstep - with unknown negative consequences to Europe's periphery.
As outlined in Game of Loans, we'd consider that more than just a Greek tragedy. 