For many years I have written a regular monthly preview of the Employment Situation Report. I have done extensive research on all of the methods and even visited the stat guys at the BLS to discuss their approach.
My preview gives appropriate respect to the BLS, but also to the leading alternative methods. My best analogy was to a bean-counting contest. The winner was NOT the contestant who was closest to the correct answer. Instead, the winner had to predict the guess of a fellow contestant.
This is what we do every month. We want to know the truth about the economy. Instead of recognizing that there are several good estimates, everyone tries to guess what the BLS will report. Please read the September preview both for a laugh and a deeper look. This month I will also do something special. In addition to tips on what to watch for, I will look back at the most recent period for which we have actual data and see who had the best estimate!
Background
We rely too much on the monthly employment report. It is a natural mistake. We all want to know whether the economy is improving and, if so, by how much. Employment is the key metric since it is fundamental for consumption, corporate profits, tax revenues, deficit reduction, and financial markets. Whenever there is an important question, we all seize on any available information. While we might know the limitations of the data, any concern is briefly acknowledged -- if at all -- and then swiftly put aside.
The Data
We would like to know the net addition of jobs in the month of November.To provide an estimate of monthly job changes the BLS has a complex methodology that includes the following steps:
- An initial report of a survey of establishments. Even if the survey sample was perfect (and we all know that it is not) and the response rate was 100% (which it is not) the sampling error alone for a 90% confidence interval is +/- 100K jobs.
- The report is revised to reflect additional responses over the next two months. This is especially important this month since the official survey response date has been moved forward by a week. This is a routine adjustment for the Thanksgiving holiday, but it increases the potential for error and later revision.
- There is an adjustment to account for job creation -- much maligned and misunderstood by nearly everyone. Everyone focuses on the birth/death adjustment. This actually accounts for less than 20% of the BLS attempt to estimate job creation.
- The final data are benchmarked against the state employment data every year. This usually shows that the overall process was very good, but it led to major downward adjustments at the time of the recession. More recently, the BLS estimates have been too low, as revealed in the most recent report. For the year ending in March, 2012, the BLS estimate was off by about 30K jobs per month overall, and 35k jobs per month on private employment. The January report will incorporate these benchmark revisions.
The BLS report is really an initial estimate, not the ultimate answer. The BLS is actually like one of the contestants, with the full report coming later. The market uses this estimate as "official" and declares winners and losers on that basis. No one pays any attention to the final data, which we do not see for eight months or so.
- ADP has actual, real-time data from firms that use their services. The firms are not completely representative of the entire universe, but it is a different and interesting source. ADP reports gains of 192K private jobs on a seasonally adjusted basis. In general, the ADP results correlate well with the final data from the BLS, but not always the initial estimate. In recent months ADP is using an improved methodology with a stronger sample. The objective is to improve the correlation with the final print of the employment data.
- TrimTabs looks at income tax withholding data. Their idea is that this is the best current method for determining real job growth. TrimTabs is forecasting a range of 135- 155K. There was a lot of year-end uncertainty about tax law from the fiscal cliff debate. TrimTabs has wisely taken note of this and reflected the potential effect.
- Economic correlations. Most Wall Street economists use a method that employs data from various inputs, sometimes including ADP (which I think is cheating -- you should make an independent estimate).
- Jeff Method. I use the four-week moving average of initial claims, the ISM manufacturing index, and the University of Michigan sentiment index. I do this to embrace both job creation (running at over 2.3 million jobs per month) and job destruction (running at about 2.1 million jobs per month). In mid-2011 the sentiment index started reflecting gas prices and the debt ceiling debate rather than broader concerns. When you know there is a problem with an input variable, you need to review the model. For the moment, the Jeff model is on the sidelines. The recent uptick in consumer confidence, despite gas prices, the fiscal cliff, and Europe, is encouraging for jobs. It remains difficult to account for the effect of headlines about Europe and the fiscal cliff. The model inputs have improved a lot. The layoffs catch the headlines, because these are big visible chunks of jobs. I do not think we have a good grasp on job creation. The BLS tries hard, but their approach lags on this front. Street estimates are generally similar to my method, but few reveal much about the specific approach. These estimates usually adjust for the ADP report.
- Briefing.com cites the consensus estimate as 180K, while their own forecast is for 195K. Their private jobs forecast is about 15-20K higher, since the loss of public jobs is a continuing drag.
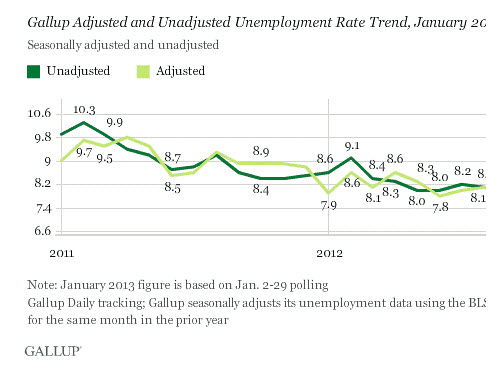
- Gallup sees unemployment as essentially unchanged at 7.8% on a non-seasonally adjusted basis. This is interesting since they have a different survey from the government, a relatively new approach to seasonal adjustment, and an extremely bearish and political approach in past commentaries. Gallup's methods deserve respect, so I am watching closely. On a seasonally adjusted basis, their unemployment rate is only 7.3%!
 Failures of Understanding
There is a list of repeated monthly mistakes by the assembled jobs punditry:
- Focus on net job creation. This is the most important. The big story is the teeming stew of job gains and losses. It is never mentioned on employment Friday. The US economy creates over 7 million jobs every quarter.
- Failure to recognize sampling error. The payroll number has a confidence interval of +/- 105K jobs. The household survey is +/- 450K jobs. We take small deviations from expectations too seriously -- far too seriously.
- False emphasis on "the internals." Pundits pontificate on various sub-categories of the report, assuming laser-like accuracy. In fact, the sampling error (not to mention revisions and non-sampling error) in these categories is huge.Negative spin on the BLS methods. There is a routine monthly question about how many payroll jobs were added by the BLS birth/death adjustment. This is a propaganda war that seems to have ended years ago with a huge bearish spin. For anyone who really wants to know, the BLS methods have been under-estimating new job creation. This will be reflected in the January report, which will show over 350K additional jobs in the benchmark year.
It would be a refreshing change if your top news sources featured any of these ideas, but don't hold your breath!
And most importantly, it would be helpful if anyone would realize that the BLS is just one estimate among others -- and perhaps not the best. The bean counter example illustrates this.
Keeping Score and Taking Names
The authoritative scorekeeper is the Business Dynamics Series. This reflects data from state employment offices, so it is an actual count, not a statistical estimate. For the breathless market observers this comes far too late, since it takes about eight months to get the data.
Fair enough. We can still use the information to figure out who made the best predictions at that time. Here we go!
We know from the business dynamics report that in Q212 there were 1.26 million jobs created at new businesses. The reason you do not know that is because it is not reported in the financial media. They focus on the estimates of net job creation, not the actual count of new job creation. It makes a difference.
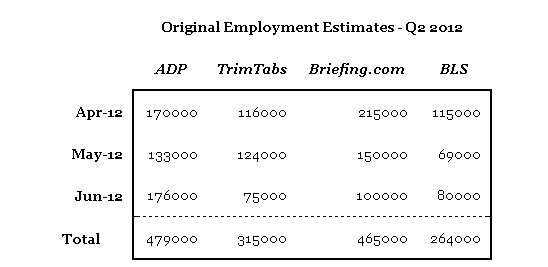
We also know that the net new private job creation was 582K. How did our contestants do? Here is a summary of the quarterly forecast from each: Key takeaways?
- All of the estimates were too low.
- The much-maligned ADP was the best, and that missed by more than 100K jobs.
- The BLS methods were the worst.
This week's employment situation report involves special risk. The results are being teed up for a failure.
Since the preliminary Q4 GDP report had a negative print, there is a quest for confirmation. Maria Bartiromo's script seems to require the word "disaster" whenever she mentions the Q4 GDP report. If today's payroll number is weak, we can expect the recessionistas to be out in force!
Here are some fearless forecasts from the Old Prof:
- Multiple pundits will jump on the benchmark revisions and ask how the BLS "found" another 350K jobs. If you look back at the history of their punditry, these will be the same people who claimed that the BLS was over-stating job growth. They do no review of their own claims.
- Much will be made of seasonal adjustments - - mostly by those who have never produced a dataset that included any seasonal adjusting!
- No one will recognize that the BLS estimate is just that --- an estimate. We already know most of the answer, and it is pretty good.
- Any extreme result will get an exaggerated interpretation. If the job growth were to be 50K, we will have claims that recession is upon us. If the BLS estimate is 300K, we will hear that the Fed is about to tighten rates!
As usual, the number is less important than everyone thinks. So here is the most important point:
The Fed is not doing anything differently based upon the January employment report. Everything that I have written here is completely understood by the FOMC. It will take a series of results to influence Fed policy.
