Bitcoin price today: gains to $90.8k as Fed cut bets remain firm
Summary
- Jamie Dimon recently predicted that interest rates would go to 5%.
- The 5- and 10-year breakeven inflation rate is nowhere near that level.
- Neither is inflation.
Never mind bracing for 4% Treasury yields, Jamie Dimon now says. Square (NYSE:SQ) up for 5%.
The JPMorgan Chase & Co CEO said Saturday that economic and market conditions already support a benchmark 10-year-note yield at 4%, regardless of what the bond market is saying.
First off, I have yet to see if he offered a time horizon for that prediction. All things being equal, I feel very sure that rates will hit 5% sometime. But as for rates hitting 5% in the foreseeable future, I just don't see it for the following reasons:
Inflation isn't that high
The Federal Reserve's preferred inflation measure is the PCE price index because it covers a much wider swath of prices. Here is a 5-year chart of its Y/Y price change:
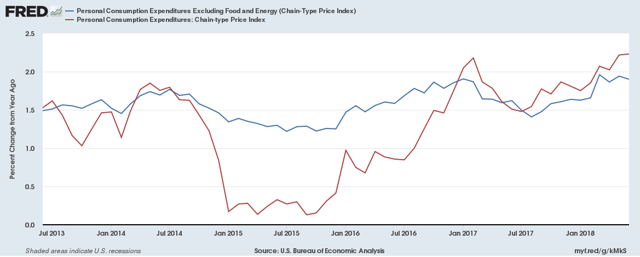
The overall index (in red) is slightly over 2% while the number ex-food and energy (in blue) is slightly below 2%. Either way, price pressures are about 300 basis points below Dimon's 5% prediction.
Although the CPI numbers are higher...
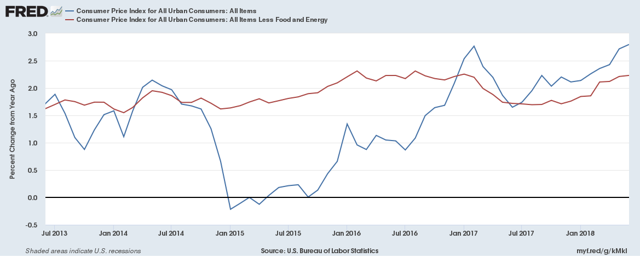
...they're about 200-300 basis points below Dimon's 5% prediction, they're also very low.
Inflation expectations are very contained:
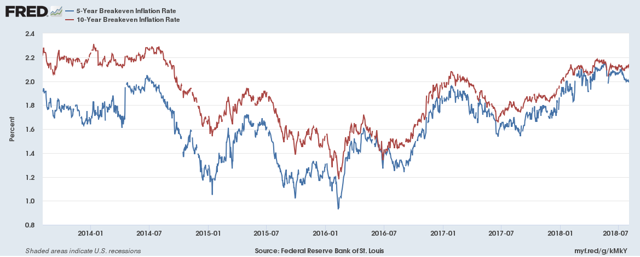
The chart above contains the 5- and 10-year breakeven inflation rate, which is the difference between the 5- and 10-year treasury and its corresponding TIPs. The difference is used to determine what traders think the 5- and 10-year inflation rate will be - a number that comprises a large percentage of the term structure of interest rates. Both are between 2% and 2.20% - which is between 280 and 300 basis points below Dimon's 5% prediction.
And then we have the University of Michigan's consumer inflation expectations:
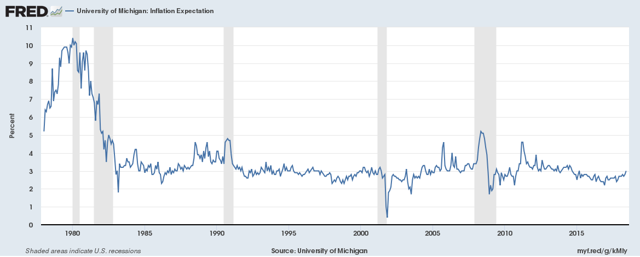
Yes, it's approaching 3%. But that is its historical average for the last three expansions.
And the PowerShares DB Precious Metals (NYSE:DBP) market is weak:
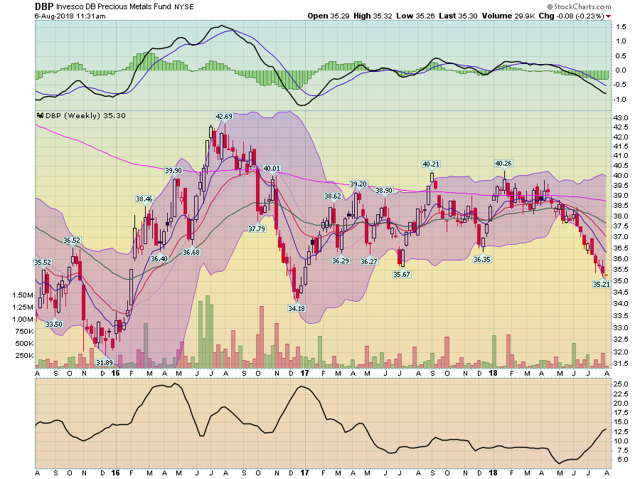
The precious metals ETF is in a clear downtrend and is in the lower half of its 5-year price range.
The natural rate of interest is low
The natural rate of interest is that level of rates that are neither stimulative nor restrictive for economic growth. It's a theoretical number that can only be calculated tangentially from other observable data. But the two methods used to calculate are both far below Dimon's 5% call.
Let's start with the Richmond Fed's number:
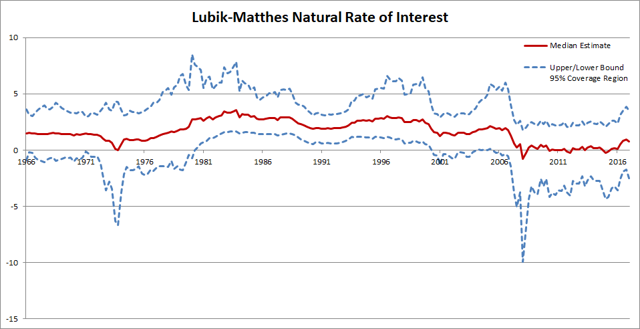
This model predicts a range of possible values. However, according to the bank's latest calculations (from March 31, 2018), the lower band, median, upper band numbers are:
| -2.255279808 | 1.017022627 | 4.521930869 |
While this number could be near Dimon's 5% rate (assuming it's in the upper band), the median number is far from where the bond market is currently trading. And, we have a second calculation from now NY Fed President John Williams that corroborates the Richmond Fed's median level:
My own view is that r-star today is around 0.5%. Assuming inflation is running at our goal of 2%, that means the typical, or normal short-term interest rate is 2.5%. For comparison, the median longer-run value of the federal funds rate in the Federal Open Market Committee's (FOMC's) most recent economic projections is 2.875% (Board of Governors 2018b). When put into a historical context, r-star stands at an incredibly low level-in fact, a full 2 percentage points below what a normal interest rate looked like just 20 years ago. This trend is not unique to the United States: Averaging across Canada, the euro area, Japan, and the United Kingdom, a measure of global r-star is a bit below 0.5% (Holston, Laubach, and Williams 2017 and Fujiwara et al. 2016).
This is also far more in line with where the bond market is currently trading.
Increased treasury issuance
Finally, Dimon may be basing his call on the higher level of treasury bond issuance used to fund the large budget deficit. However, so far the market is absorbing that increased issuance with ease. And, I'm not anticipating a great deal of trouble doing the same going forward. This is due to the increased demand for safe assets caused by an aging population in Japan, the U.S., and the EU.
Conclusion
There is no data that confirms Dimon's call. Inflation is far below 5%, as are inflation expectations. R* is low as well and the global demand for safe assets is strong. There's just nothing to support his call.
Disclosure: I/we have no positions in any stocks mentioned, and no plans to initiate any positions within the next 72 hours.
I wrote this article myself, and it expresses my own opinions. I am not receiving compensation for it (other than from Seeking Alpha). I have no business relationship with any company whose stock is mentioned in this article.
