My asset inflation-deflation timer model moved to a neutral position last week, indicating that investors should take some risk off the table. My analysis suggests that this is not a run for the bunker call, but a call for a volatile market without a great deal of direction.
Trend breaks everywhere
To set the stage, there were trend breaks everywhere. The SPX decline through its 50-day moving average and a upward sloping trend line that began in June (shown in blue), but the longer term uptrend (in red) remains intact and the index remains above its 200-day moving average. This is not a disaster, nor is is a market crash warning.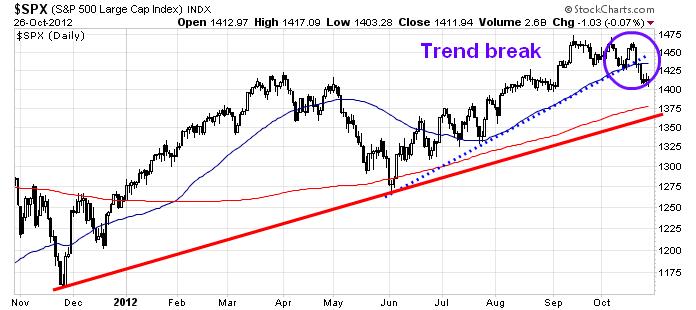
This trend break were confirmed by intermarket analysis. The price action of other averages showed similar kinds of sideways action of broken trend lines. As an example, the STOXX 600 moved through its 50-day moving average, though it is now testing an important support zone.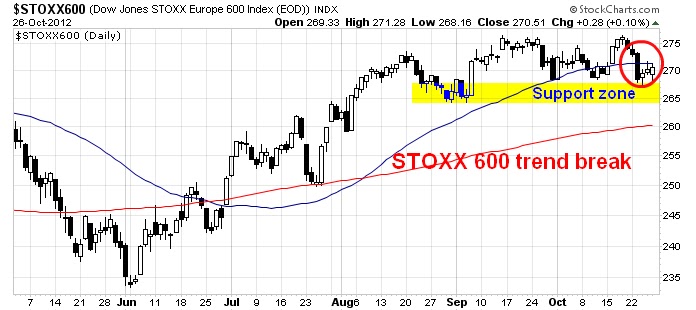
Commodity prices also displayed similar levels of weakness. Dr. Copper, which is one of the most important industrial commodities, has been falling and is now testing an important technical support as represented by its 50% Fibonacci retracement level.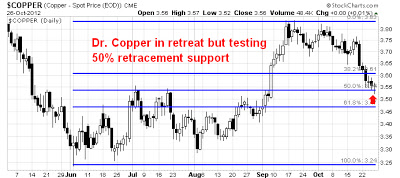
The bull case
While the technical damage is evident, these are not portents of impending disaster. There are good reasons to be bullish and much could still go right in the macro environment.
- China is seeing a soft landing. I have detailed in my previous posts of how Chinese data is starting to turn up (see China dodges a bullet? and also see Business Insider: More Proof That The Worst Of The Chinese Slowdown Is Over).
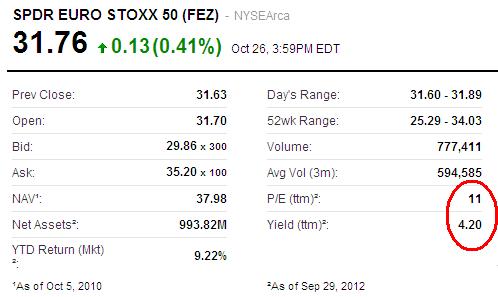
- Europe is cheap and its tail risk is highly diminished. Sure, the eurozone is in recession, but the ECB has taken tail risk off the table and a glance at the Euro STOXX 50 ETF (FEZ) shows the trailing P/E ratio (none of this forward P/E funny stuff) to be 11 and the dividend yield at 4.2%. How much cheaper do you need European equities to get?
- The US economy continues to grow. Housing continues to be a bright spot. Employment and consumer spending continue to see upside surprises. Continuing claims continue to see positive surprises and Gallup's tracking poll shows the unemployment rate cratering and I will be taking the "over" bet in the NFP sweepstakes this coming Friday [emphasis added]:
and at a new low since Gallup began collecting employment data in January 2010. Gallup's seasonally adjusted unemployment rate is 7.7%, also down from September. October's adjusted mid-month measure is also more than a percentage point lower than October 2011. 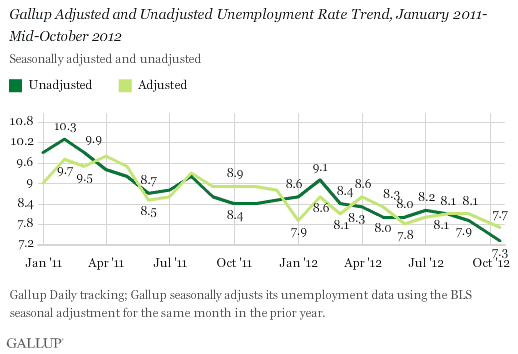
While the major averages have declined through their uptrends, sentiment indicators are still supportive of an advance. At the very least, major declines generally do not begin with readings at these levels. The AAII sentiment survey (via Bespoke) shows the percentage of bulls to be well below average, which is contrarian bullish: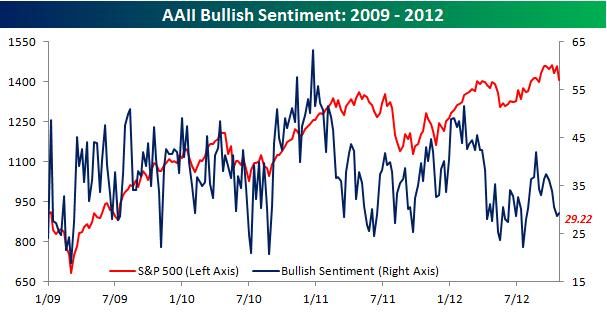
The CS Index of risk appetite (via Sober Look) is still rising, indicating that the bulls still enjoy the upper hand.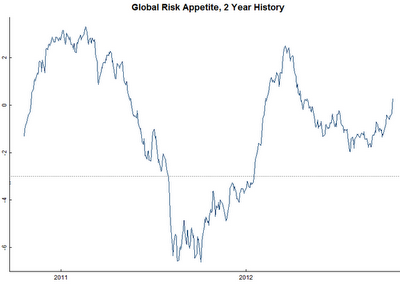
Bear case: It's all about valuation and earnings
In the face of these reasons to be bullish, I have been struggling with the fundamental reasons for the recent sloppy market action. My conclusion is that market psychology is in transition to one that focuses on top-down macro disaster risk to a more traditional market that focuses on valuation and earnings.
From a long term valuation viewpoint, equities aren't screamingly cheap.This chart of market cap to GDP (via Vector Grader), which is analogous to an aggregated price to sales ratio for the US economy, shows market cap to GDP ratio to be still above its long term average and it is declining. At the current rate of decline, the stock market may see a generational bottom around the end of this decade.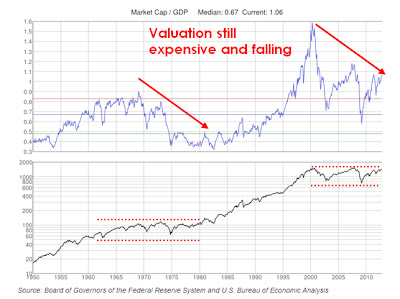
Similarly, Chart of the Day showed a longer term perspective for the market's P/E ratio and, despite the fall, P/E ratios are not at the bottom of its historical range where long-term investors should be buying: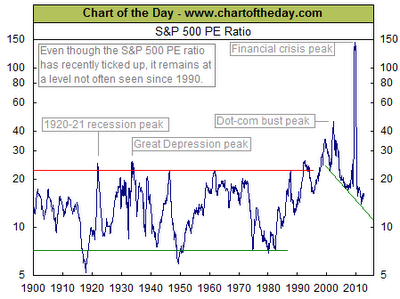
What's more, the earnings in this Earnings Season have been punk. Despite going into reporting season with very low expectations, the earnings beat rate is only about the same level of historical beat rates, sales reports have generally been coming in below expectations and guidance has been negative.
I would attribute the disappointing earnings reports to a bifurcated growth rate in the US economy. While consumer confidence and employment have been rising, business confidence and capital investment has been falling. My hypothesis is that the returns to capital vs. labor got over-stretched and the balance is starting to swing towards labor. That's why we are seeing better employment and consumer confidence, but the returns to capital are diminishing and the earnings disappointment that we are seeing now is the result of margin compression. While the American economy will likely continue to growth, stock prices may not follow because margins - and therefore earnings are getting squeezed.
On October 18, 2012 (see Insider selling explained?), I wrote:
Take a look at this chart of the divergence between the consumer confidence and business confidence. I proxied the former with the University of Michigan consumer sentiment (in blue) and real retail sales (red) and proxied business confidence with Manufacturers' new orders (green). 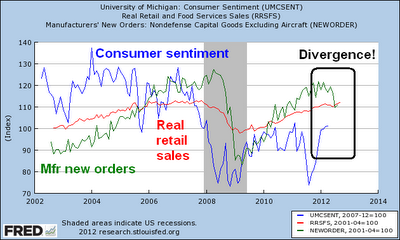
A recipe for volatility
The bottom line is the current environment is a recipe for continued volatility and choppiness. Bulls have much to look forward to and bears are anticipating a transition to a market where earnings matter more - and the earnings outlook is disappointing.
Barry Ritholz also turned more cautious last week and I generally agree with his assessment:
I don’t imagine we go straight down from here; There will be sell offs and rallies, pre and post elections. There will be some data points that suggest things aren’t so bad, and then some that are awful. It is not a black and white situation. I do believe the low volatility we have seen may very well become a thing of the past, and the VIX is becoming a definitive Buy.
Disclosure: Cam Hui is a portfolio manager at Qwest Investment Fund Management Ltd. ("Qwest"). This article is prepared by Mr. Hui as an outside business activity. As such, Qwest does not review or approve materials presented herein. The opinions and any recommendations expressed in this blog are those of the author and do not reflect the opinions or recommendations of Qwest.
None of the information or opinions expressed in this blog constitutes a solicitation for the purchase or sale of any security or other instrument. Nothing in this article constitutes investment advice and any recommendations that may be contained herein have not been based upon a consideration of the investment objectives, financial situation or particular needs of any specific recipient. Any purchase or sale activity in any securities or other instrument should be based upon your own analysis and conclusions. Past performance is not indicative of future results. Either Qwest or Mr. Hui may hold or control long or short positions in the securities or instruments mentioned.
