
Next week's calendar is busy
Not only will the earnings season be in full bloom next week, but traders will have the opportunity to react to a substantial number of data points. Some of the notable events will be Tuesday's retail sales, Wednesday's Fed Beige Book, Thursday's housing starts, and Friday's CPI.
If the recent downturn in economic data was, in fact, weather related as many economists suggested, we should see things firm in the next few weeks.
Don't forget, the tax deadline is creeping up on us. Although it feels like a bulk of the tax liquidation has already occurred, we could get one more wave early next week so don't let any Monday/Tuesday blip lower change your overall view of the markets. Tax selling has little to do with fundamentals, charts, or opinion. 
Treasuries bounce into the weekend
Bonds and notes traded moderately higher for most of Friday. The buying was most likely related to position squaring and profit taking by the bears ahead of the weekend. However, some analysts are pointing out that while U.S. yields are historically low, they are actually high relative to other government issued debt.
For example, investors purchasing government backed fixed income securities in Germany, Japan, the UK, and France are all receiving far less yield than those purchasing U.S. bonds and notes. To put things in perspective, the U.S. 10-Year note yield is roughly 1.928% but the Germany 10-Year bond is a mere 0.149%. It isn't far fetched to imagine a scenario in which German securities fall into negative yield territory. In other words, investors would be essentially paying the German government to hold their money, instead of the other way around.
We've maintained in recent months that we doubt this phenomenon alone will be enough to keep our domestic bonds and notes afloat. We continue to believe the best trades are from the short side on rallies.
Treasury Market Ideas
**Consensus:** The best trades should be from the short side on sharp rallies. If you were able to capitalize on the post-payroll reversal, be sure to protect profits! It will be a bumpy ride.
**Numbers based on June contract!**
**Support:** ZB : 162'06, and 159'13 ZN: 128'19, 127'01, and 126'00
**Resistance:** ZB : 166'20, 167'18, 168'12, and 171'07 ZN: 129'17, and 130'13 and 130'26
Position Trading Recommendations
*There is unlimited risk in option selling
None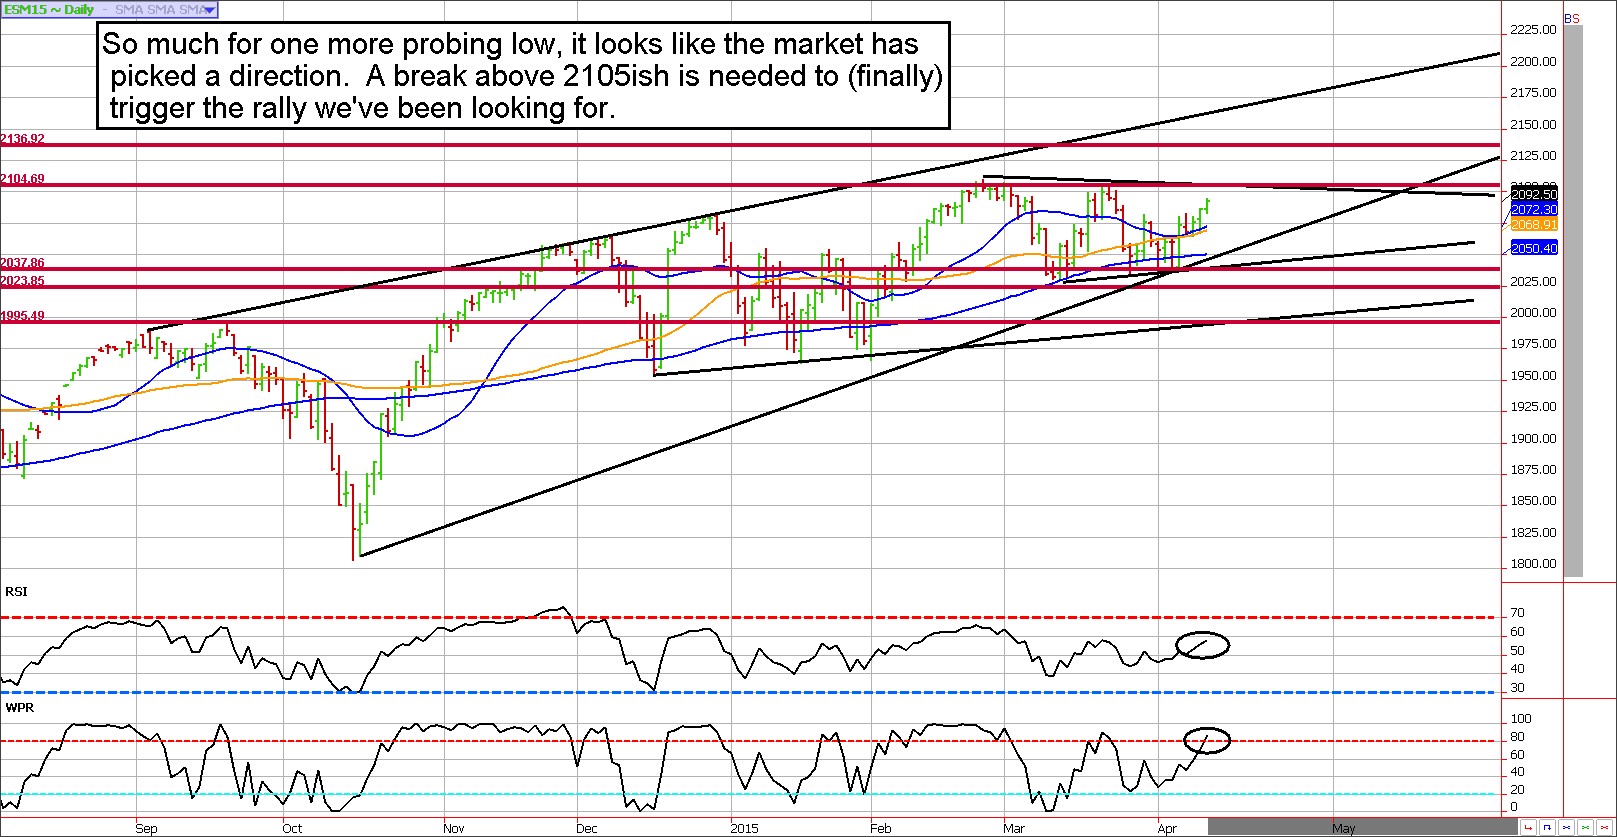
Apparently a test of 2020ish support wasn't part of the plan, is this the break-out we've been looking for?
It feels like we could finally be in the process of the break-out rally we've been looking for. A break above 2106ish will confirm the rally, which we project to extend into the 2170ish area (the top of the long-term up-trend channel). However, as we've noted before, there is a strong possibility that, if seen, the 2170ish price range could represent the juncture at which the buying has run its course.
Not only will the market be facing technical headwinds at the aforementioned price, but if the timing works out it will most likely occur at the tail end of the seasonally supportive season.
Traders should note that according to MRCI's seasonal service, there is a high probability buy in the ES (e-mini S&P 500) on, or about, April 14th. Further, Over the previous 15 years, buying the ES on the 14th and selling on, or near, May 3rd has been profitable 87% of the time (or 13 out of 15 years). It's generally a bad idea to try to fight these types of stats.
Stock Index Futures Market Ideas
**Consensus:** We're overall bullish through April. Any large dips will likely prove to be buying opportunities, a break above 2106 confirms the up-trend and suggests a possible run to 2170ish.
**Support:** 2036, 2021, and 1995
**Resistance:** 2101, 2136, and 2170
Position Trading Ideas
Flat
Day Trading Ideas
**These are counter-trend entry ideas, the more distant the level the more reliable but the less likely to get filled**
Sell Levels: Let's see what Monday looks like
Buy Levels: Let's see what Monday looks like In other markets....
December 19 - Get long the Aussie Dollar in a small way using e-micro futures. We were buying near .8120 to .8080.
March 5 - Roll March Aussie micros into June to give us more time.
March 19 - Sell May 112 calls and 100 puts in the Euro for about 64 ticks or $800.
March 24 - Buy back May Euro 100 puts to lock in profit of about 20 ticks, or $250. per contract before transaction costs.
March 26 - Buy back May Euro 112 calls and then sell the 113.50 calls and 104 puts to replace them.
April 1 - Buy a July soybean $11.10 call for 5 cents ($250).
April 9 - Buy back the Euro 113.50 calls to lock in a profit of about $430 to $450 before transaction costs, and depending on fill prices.
Disclaimer: Due to time constraints and our fiduciary duty to put clients first, the charts provided in this newsletter may not reflect the current session data.
**Seasonality is already factored into current prices, any references to such does not indicate future market action.
**There is substantial risk of loss in trading futures and options.**