
Following OPEC’s surprise production cut in April that saw crude oil squeeze from $65 to $80 per barrel in a manner of days, hedge funds and the like have once again resumed selling on slowing growth and recession fears. As we can see below, few commodities outside of precious metals and a few ags have been able to escape the growth slowdown and have corrected accordingly. Energy has been front and center of this dynamic. However, while the OPEC put may have only provided a temporary relief in oil prices thus far, a number of fundamental indicators of the oil market are suggesting the tide may be beginning to turn.
It’s been a rough year or so for energy, but let’s not forget the significant headwinds prevailing for oil prices in recent times. The past 12 months have seen the Chinese economy on hold for over 200 days, a warmer than usual North America and Europe, the Biden administration draining roughly 300 million barrels from the Strategic Petroleum Reserve, Russia releasing much of their own energy supplies onto the market prior to their sanctions coming into effect, as well as a slowing global economy. And yet, amid all these woes, inventory levels only moved into bearish territory for a small amount of time.
Given a number of these headwinds are no longer present, the rapid shift back toward inventory drawdowns is perhaps illustrative of the structural demand and supply imbalance present within the market. What’s more, the actual impact of any OPEC production cuts won’t be felt for some months still given they’re not slated to take effect until May.
For crude oil, analysing the inventory changes and inventory levels provides a decent real time proxy for the supply and demand dynamics within the market. This shift from inventory builds to drawdowns and to overall levels below the seasonal average is certainly a bullish development, particularly in the context of last week’s 12.54 million bbl drawdown being the ninth largest in US history.
Elsewhere in the physical market, the WTI crude oil futures term structure largely remains in backwardation. Generally, when the further dated contract prices are trading at a discount to the spot and short-dated contracts, meaning the market is in backwardation, this implies there is a supply deficit as market participants are willing to pay a premium for instant delivery, despite the additional costs associated with said delivery. As a result, any deficit will need to be met via drawing down inventories. While backwardation incentivises drawdowns of oil inventories, it does not incentivise producers to increase production and capacity, as they would be forced to sell forward new production at a lower cost than today. This is why assessing shape of the term structure for a physical commodity such as oil provides a key insight into the underlying demand and supply dynamics, and why a backwardated term structure is usually more supportive of higher prices.
While parts of the term structure have flirted with contango during the latter stages of 2022 and early 2023 as the market sold off, the market has by and large returned to a state of backwardation, implying there is an overall supply deficit.
In terms of positioning, after April’s squeeze from their lowest net-position in years to being heavily long oil, money managers in the futures market have since been slowly unwinding their longs to reside in a relatively neutral state. Consisting of hedge funds and CTAs, these market participants are generally responsible for driving much of the trend in price, though at current levels do not provide any clear contrarian signal.
But, if we isolate CTA positioning, we can see these systematic based traders remain heavily net-short relative to history. There is plenty of scope for CTA’s to become material buyers in the oil market should the current downtrend reverse course.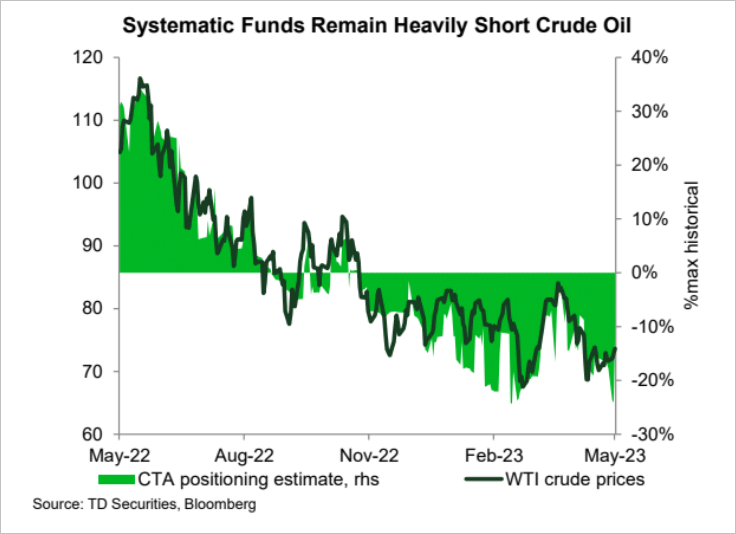
Meanwhile, overall speculative positioning remains near its lowest level in a decade. Though much less of a market timing tool when compared to the hedge fund or CTA component above, overall speculative positioning at such levels illustrates the upside potential for the market should the tide turn, while also suggest energy may be nearing a contrarian buying opportunity for those bullish long-term.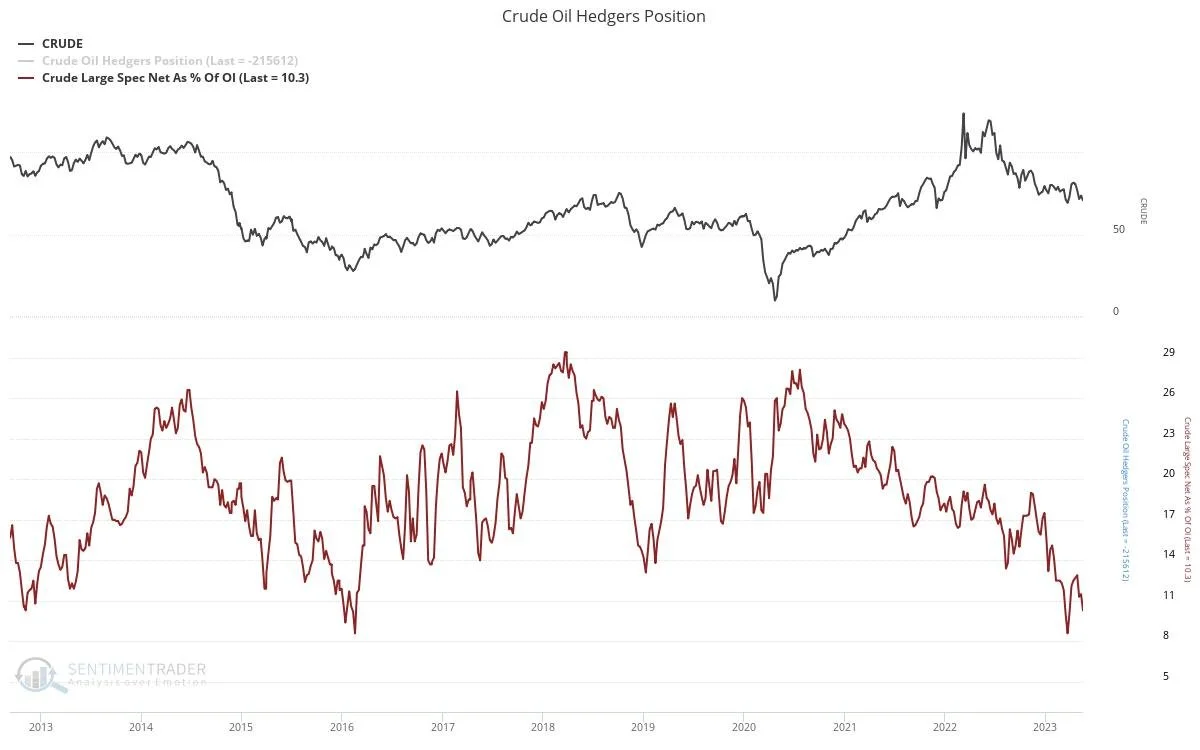
Turning to the macro outlook, traders have undoubtedly been expressing their bearish macro views through oil in recent times. Unsurprisingly, this dynamic in conjunction with the release of the SPR and China lockdowns among others have seen oil trade lower precisely in-line with the US manufacturing PMI, my preferred proxy for the business cycle. Given the outlook for the business cycle remains suspect at best for the remainder of 2023, the economic growth story is likely to remain a headwind for energy. Whether it can move higher in spite of such factors largely depends on whether the supply constraints will outweigh the potential demand destruction that may result from a growth slowdown, or potential recession.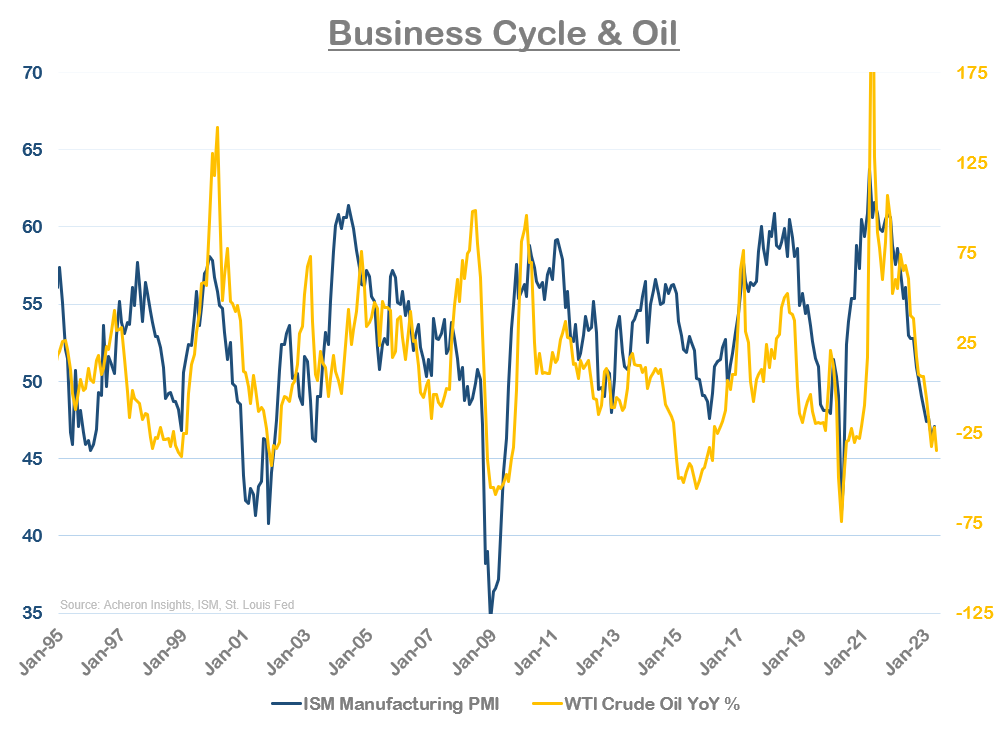
Much like the growth outlook, the technical picture looks weak. Oil has been in a clear downtrend for nearly 12 months now and this recent rally looks to have been rejected by the 50-day moving average. On a positive note, momentum looks to be slowly diverging positively to price, perhaps indicating this correction is looking a little long in the tooth and the downturn is losing steam. If oil can manage to break the 50-day moving average and subsequently go on to make another higher low then a reversal could be on the cards. Conversely, a break below the $65 area would be worrying and no doubt would elicit additional supportive measures from OPEC.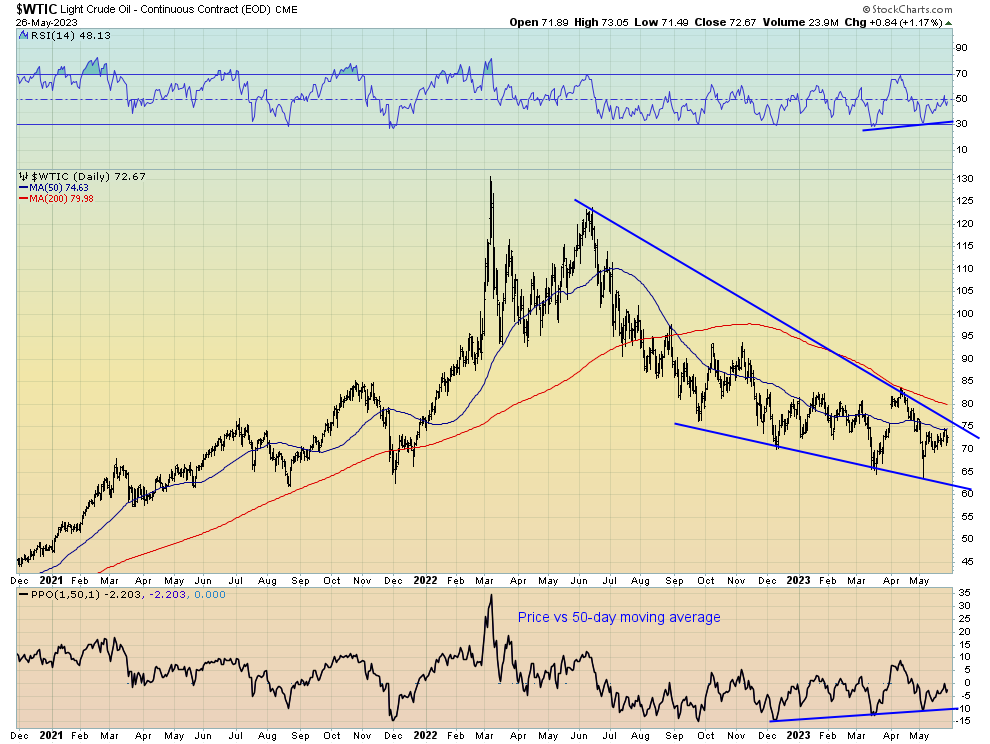
In the bullish camp however is seasonality, of which the summer months in the northern hemisphere have generally been supportive of higher oil consumption and thus higher prices. 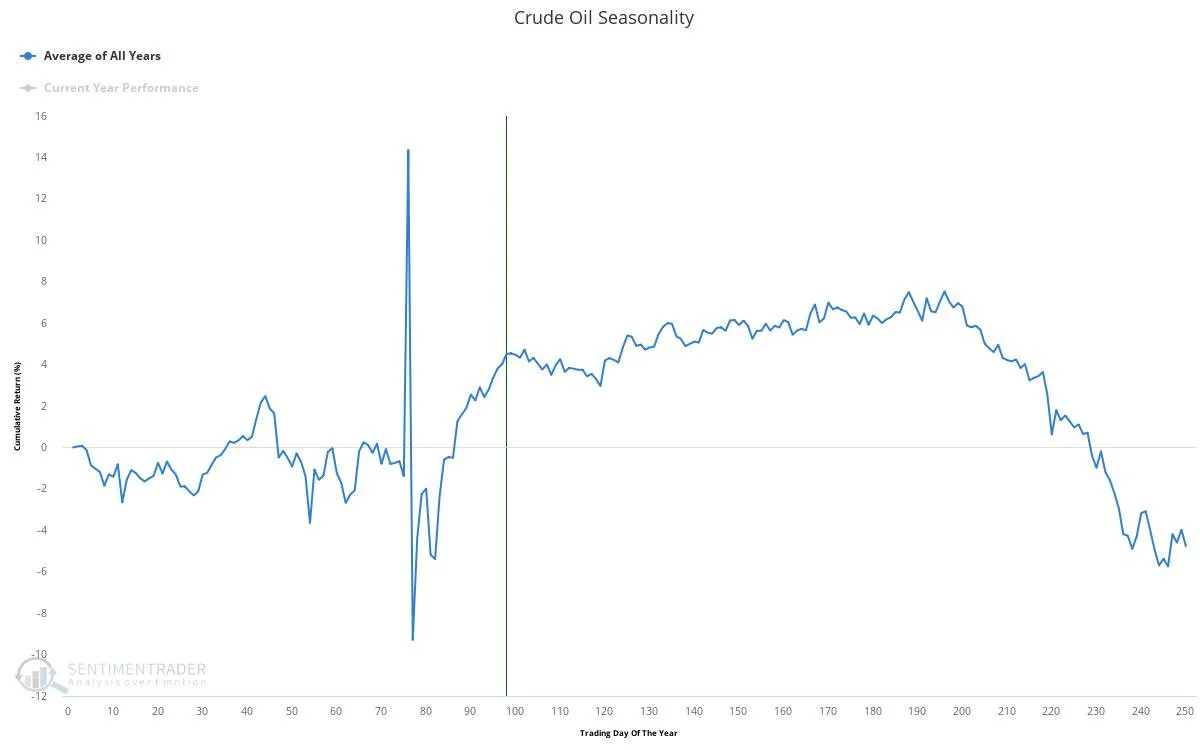
Conclusion & Key Takeaways
In summary, while the technical picture and macro landscape remain headwinds for energy markets, a number of fundamental indicators generally supportive of higher energy prices are beginning to shift in a positive direction. In the physical market, we have again returned to a state of inventory drawdowns, while the term structure is entirely backwardated. Together, these indicators suggest the market is tight, while the headwinds facing markets for much of the past year - China lockdowns, SPR releases etc. - are now far less prevalent. When we consider overall speculative positioning is the most bearish it has been in quite some time, the potential for much higher oil prices in the not-so-distant future are within the realm of possibility, particularly if the US economy continues to display resiliency. For those convinced we are heading for recession, perhaps another rally in oil is the catalyst.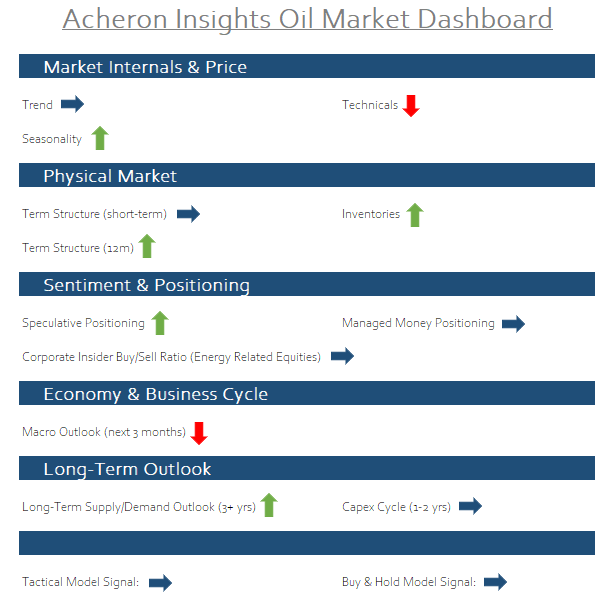
A Few Closing Comments
In the grand scheme of things, the culprit of the persistent tightness in the physical market is the structural supply constraints. Although we have seen a pick-up in capital expenditures by oil exploration and production companies in response to the higher prices of 2022 (yellow line inverted below), the response has been related muted compared to historical spikes in oil. This is the crux of the bull-base for higher energy prices moving forward; through a combination of ESG pressures and a political shift in favour of renewable energies, oil companies are being forced to be far more responsible with their capital and as a result, their ability to increase supply in response to higher prices is being severely compromised. Given I do not view renewable energy sources as a viable base-load alternative to traditional fossil fuels given their significant shortcomings, nor do I see overall energy demand reducing anytime soon, this supply and demand mismatch should see prices move higher over time. For me, it remains a matter of when, not if.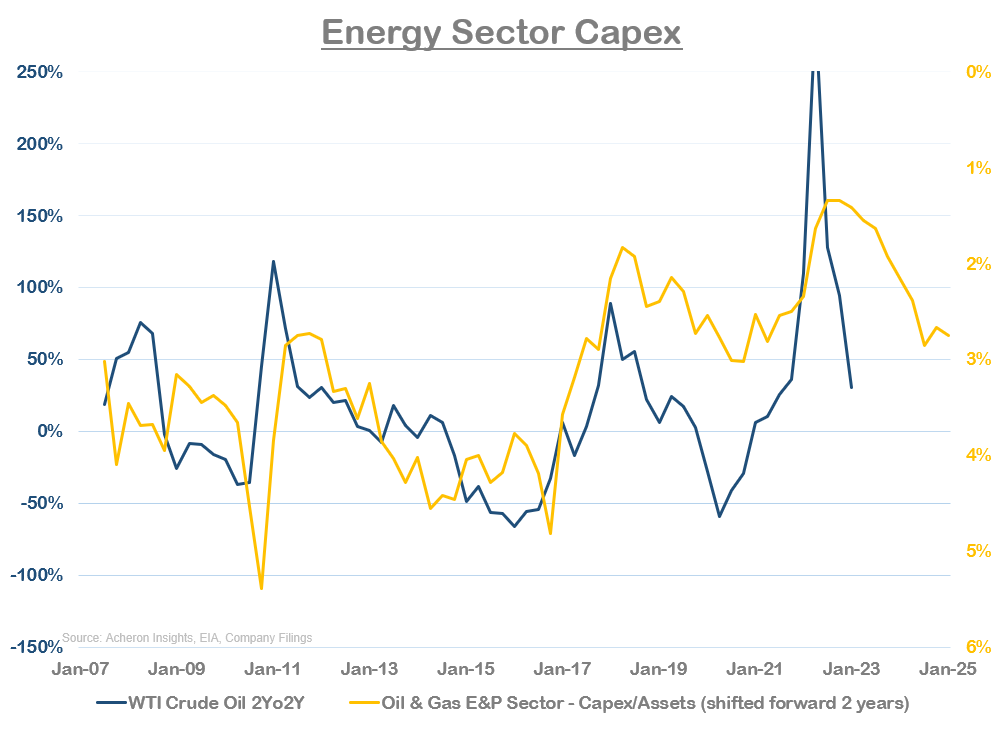
- English (UK)
- English (India)
- English (Canada)
- English (Australia)
- English (South Africa)
- English (Philippines)
- English (Nigeria)
- Deutsch
- Español (España)
- Español (México)
- Français
- Italiano
- Nederlands
- Português (Portugal)
- Polski
- Português (Brasil)
- Русский
- Türkçe
- العربية
- Ελληνικά
- Svenska
- Suomi
- עברית
- 日本語
- 한국어
- 简体中文
- 繁體中文
- Bahasa Indonesia
- Bahasa Melayu
- ไทย
- Tiếng Việt
- हिंदी
Is This The Turning Point For Energy Markets?
Published 05/26/2023, 08:25 PM
Updated 07/09/2023, 06:31 AM
Is This The Turning Point For Energy Markets?
3rd party Ad. Not an offer or recommendation by Investing.com. See disclosure here or
remove ads
.
Latest comments
Good article thk you
Install Our App
Risk Disclosure: Trading in financial instruments and/or cryptocurrencies involves high risks including the risk of losing some, or all, of your investment amount, and may not be suitable for all investors. Prices of cryptocurrencies are extremely volatile and may be affected by external factors such as financial, regulatory or political events. Trading on margin increases the financial risks.
Before deciding to trade in financial instrument or cryptocurrencies you should be fully informed of the risks and costs associated with trading the financial markets, carefully consider your investment objectives, level of experience, and risk appetite, and seek professional advice where needed.
Fusion Media would like to remind you that the data contained in this website is not necessarily real-time nor accurate. The data and prices on the website are not necessarily provided by any market or exchange, but may be provided by market makers, and so prices may not be accurate and may differ from the actual price at any given market, meaning prices are indicative and not appropriate for trading purposes. Fusion Media and any provider of the data contained in this website will not accept liability for any loss or damage as a result of your trading, or your reliance on the information contained within this website.
It is prohibited to use, store, reproduce, display, modify, transmit or distribute the data contained in this website without the explicit prior written permission of Fusion Media and/or the data provider. All intellectual property rights are reserved by the providers and/or the exchange providing the data contained in this website.
Fusion Media may be compensated by the advertisers that appear on the website, based on your interaction with the advertisements or advertisers.
© 2007-2024 - Fusion Media Limited. All Rights Reserved.