Presidents’ Day in the US meant that things were rather quiet and the week started with slow and thin trading conditions. We saw some interesting levels met and rejected from though. Particularly the pound which has now rejected from the sell zone that I set out last week. Elsewhere the USD% index has rejected from major lows that have defined the range now for many months so overall we could be seeing the beginning of a slight turn around in the markets.
This week’s main data points are as follows:
Tuesday Feb 18
12:30am AUD Monetary Policy Meeting Minutes and Statement
Tentative JPY BOJ Press Conference
9:30am GBP CPI y/y
10:00am EUR German ZEW Economic Sentiment
1:30pm USD Empire State Manufacturing Index
Wednesday Feb 19
9:30am GBP Claimant Count Change
9:30am GBP Unemployment Rate
9:30am GBP Average Earnings Index 3m/y
1:30pm USD Building Permits
1:30pm USD PPI m/m
1:30pm USD Housing Starts
7:00pm USD FOMC Meeting Minutes
11:50pm JPY Trade Balance
Thursday Feb 20
1:45am CNY HSBC Flash Manufacturing PMI
7:00am EUR German PPI m/m
8:00am EUR French Flash Manufacturing PMI
8:00am EUR French Flash Services PMI
8:30am EUR German Flash Manufacturing PMI
8:30am EUR German Flash Services PMI
9:00am EUR Flash Manufacturing PMI
9:00am EUR Flash Services PMI
1:30pm USD Core CPI m/m
1:30pm USD Unemployment Claims
1:30pm USD CPI m/m
2:00pm USD Flash Manufacturing PMI
3:00pm USD Philly Fed Manufacturing Index
Tentative USD Fed Chair Yellen Testifies
11:50pm JPY Monetary Policy Meeting Minutes
Friday Feb 21
Day 1 ALL G20 Meetings
9:30am GBP Retail Sales m/m
10:00am EUR EU Economic Forecasts
3:00pm USD Existing Home Sales
6:45pm USD FOMC Member Fisher Speaks
all times are GMT
USD% Index
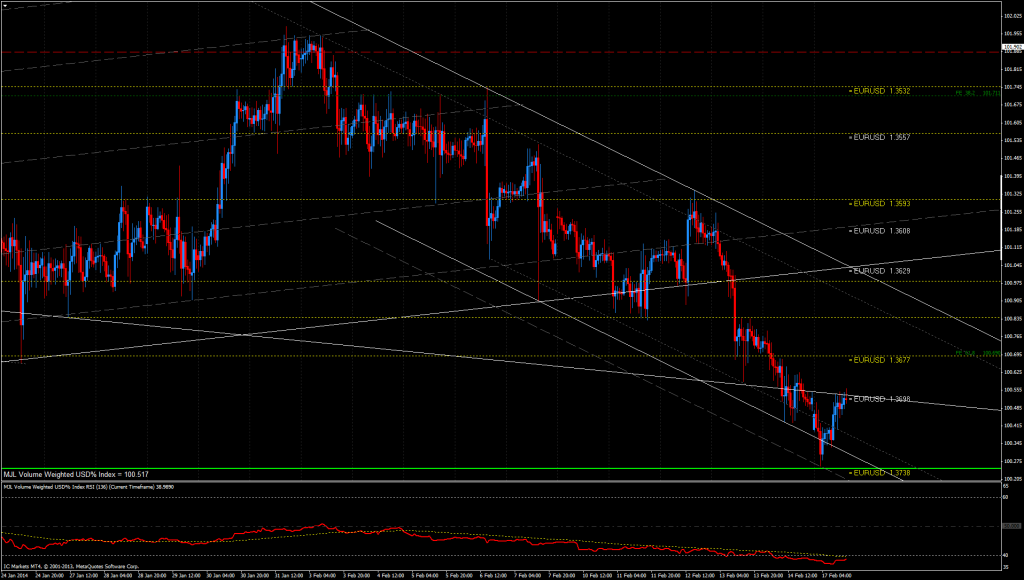
Last weeks continuous dollar selling has brought us to the bottom of the medium term range that has held dollar price action for some time now. The index has rejected strong support perfectly with RSI well into oversold and we have begun to rally away from the major low. We are now slightly up on the day and resting at broken support turned resistance, with the next levels above here suggesting EUR/USD 1.3677 as the next major hurdle. Of course, there is nothing to stop this rally from being nothing more than a place to enter for a bearish dollar trend continuation with 1.3630 as the level to break or reject from, we can’t remain range bound for ever after all, but with gold rally beginning to look tired and a possible return to selling there we could quite easily push back up to the highs of the recent ranges once again. I bullish USD.
USD% Index Resistance (EUR/USD support): EUR/USD 1.3700, 103677, 1.3629, 1.3600
USD% Index Support (EUR/USD support): EUR/USD 1.3738, 1.3800
EUR% Index
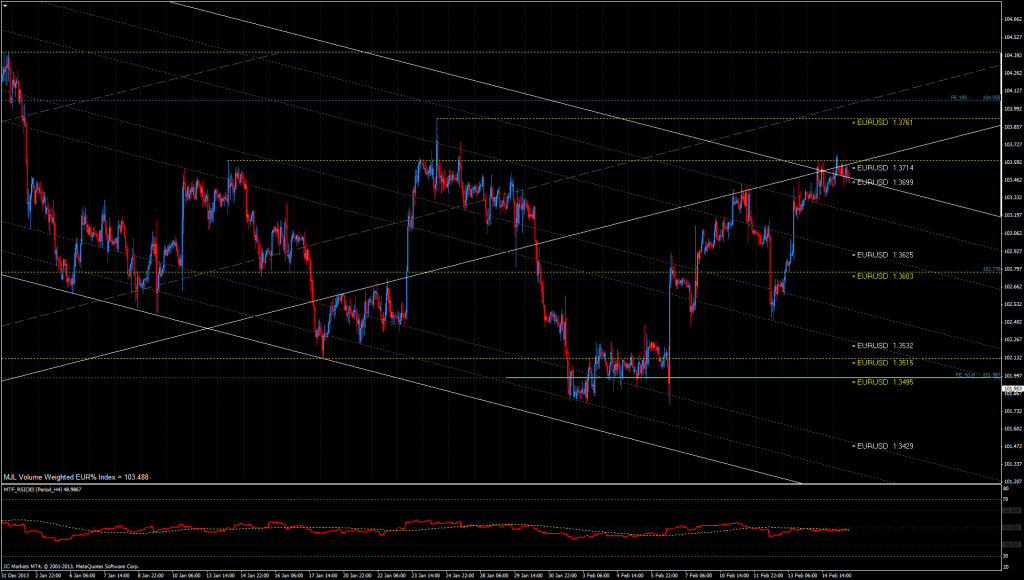
Of great interest currently is the EUR% index’s failure to break back inside the broken bullish channel. We have broken the bearish channel, just about, so currently sit in no-man’s land in terms of technical direction. With the dollar looking so overbought and primed for a rally it would only take a minor piece of news to push us lower as sentiment is beginning to think about changing and a decision for the medium term will need to be made sooner rather than later. Of course, it would not take much of a rally to break to the upside and RSI suggests that we have plenty of headroom above before overbought is met. The next few days will be critical. I am neutral / bearish EUR.
EUR% Index Resistance: EUR/USD 1.3714, 1.3761
EUR% Index Support: EUR/USD 1.3700. 1.3650. 1/3625
JPY% Index
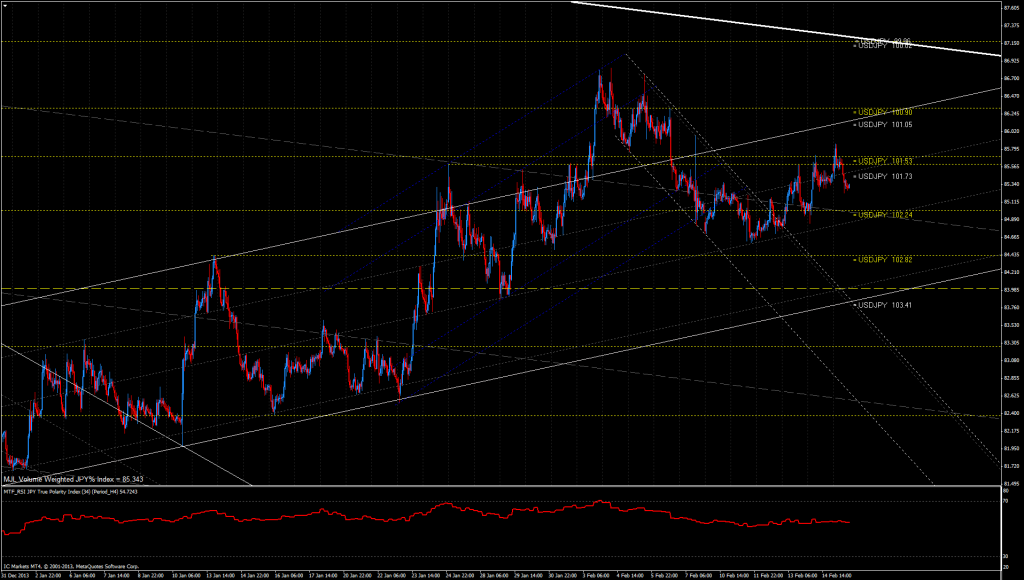
We’re still making higher highs for the JPY% index although progress is very slow. As such a cautious bullish outlook for the Yen should still be held until we begin to see stronger clues that price action will begin to turn. I find it hard to believe that we will get so close to the major resistance shown as the thick white bearish trend line without testing it so it seems sensible to expect a JPY% rally up to there before the turn. An alternative scenario is for a push lower to form a bearish head and shoulders and propel us lower for the index. I am bullish JPY until USD/JPY 100.00 is tested.
JPY% Index Resistance (USD/JPY Support): USD/JPY 101.00, !! 100.00 !!
JPY% Index Support (USD/JPY Resistance): USD/JPY 101.50, 102.25, 102.82, 103.00, !! 103.50 !!
GBP% Index
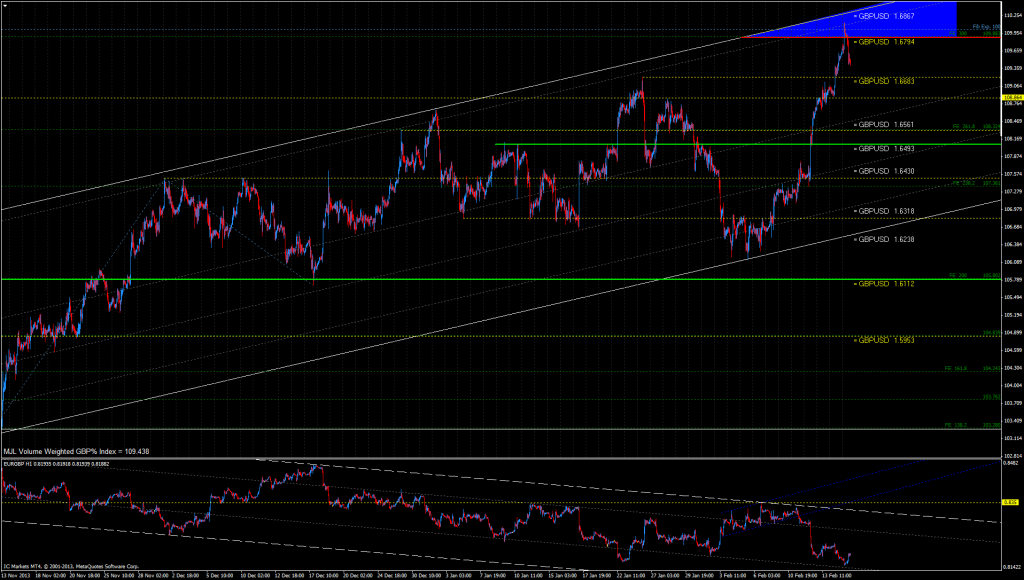
Very interestingly we have seen a good rejection for the sell zone outlined in blue which is a confluence of a longer term 300% fib expansion, and a nearer term 100% fib expansion and the top of the current bullish channel. The downside for the index has also been mirrored by upside for EUR/GBP which is also a positive sign for the beginnings of a sell-off for the pound, since the two are typically negatively correlated. We should still be cautious around index support as traders may simply enter for trend continuation rather than begin a down trend although we can now expect to see further bearish price action for the time being with the potential for a push down to the bottom of the channel. If we see another push higher, a double top may be a good place to enter short. I am bearish GBP
GBP% Index Resistance: GBP/USD 1.6867, 1.6794,
GBP% Index Support: GBP/USD 1.6683, 1.6561 , 1.6500
AUD% Index
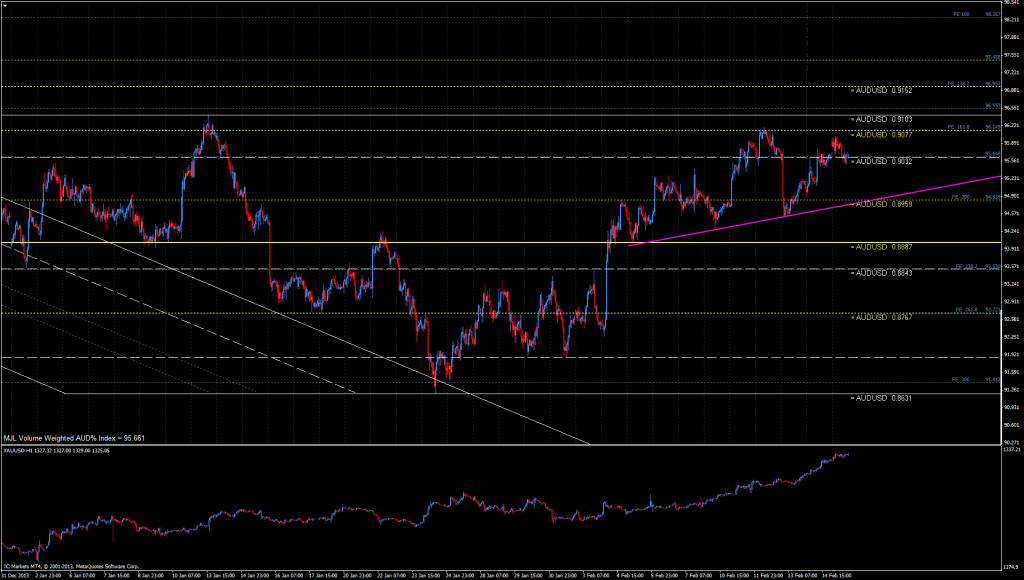
We’ve almost seen a double top for the index although progress remains slow. The sharp sell-off from these levels last week and slow recovery suggests a risk that we could see the big guns entering short once again soon if we begin to see further bearish price action. Of key importance right now is the rally in gold. Not only is it weakening the dollar but it is causing the highly correlated Aussie to rally, aided by a lack of belief that the RBA will no longer want to act to raise rates to help the struggling economy. Monday saw a stall after a long rally but we need to see sellers enter to push us lower there, however, with it widely publicised that the buyers in gold are the Chinese central bank, few will want to trade against such deep pockets. I am bearish / neutral AUD.
AUD% Index Resistance: AUD/USD 0.9033, 0.9077, 0.9100
AUD% Index Support: AUD/USD 0.8960, 0.8888, 0.8844
CHF% Index
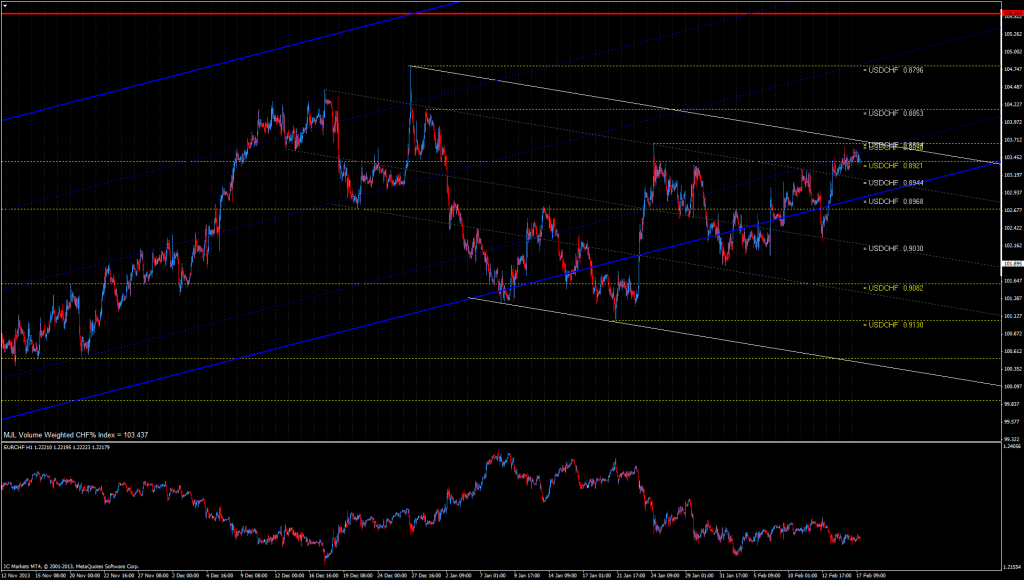
The Swiss franc is very close to testing the top of it’s bearish channel so a break of those key levels will be quite telling in terms of medium term outlook. Although this does not have as much weight as it normally would due to the very choppy nature of the markets currently pushing through key levels only to reverse on the next piece of data. This makes trend line trading rather treacherous, so a break of resistance should be a strong break before we can read too much. It is entirely possible that the dollar continue to rally and we could in fact hold from those levels. I am neutral / bearish CHF.
CHF% Index Resistance (USD/CHF support): USD/CHF !! 0.8900 !! , 0.8891, 0.8850
CHF% Index Support (USD/CHF resistance): USD/CHF 0.8944, 0.8968, 0.9000
