
A flurry of good news lifted airline stocks higher last week, reversing a drop in altitude that’s weighed on the industry so far in 2016. Fueled primarily by a bullish report from Deutsche Bank, American Airlines Group (NASDAQ:AAL), Delta Air Lines Inc (NYSE:DAL) and United Continental Holdings Inc (NYSE:UAL) collectively advanced 6.5 percent last Tuesday alone. The German bank’s all-clear signal halted a six-month slide on overcapacity, Brexit uncertainty and heightened fears of global terrorism.

Leading the group was American Airlines, which announced last Tuesday that it would renew its credit card deals with both Citigroup (NYSE:C) and Barclays (LON:BARC), a move that’s estimated to add $1.55 billion to the carrier’s pretax income over the next three years—$200 million this year, $550 million in 2017 and $800 million in 2018.
The agreement will allow Citi to offer its credit cards to new customers on American Airlines’ website and mobile apps, through direct mail and in Admirals Club lounges, while Barclaycard will be permitted to reach customers in airports and during American flights.
Investors also rewarded Delta for better-than-expected profits, which rose 4.1 percent to $1.55 billion in the second quarter. In an effort to push up fares, the number two carrier announced plans that it would cut capacity on U.S.-U.K. flights due to British pound weakness following Brexit.
Playing the Long Game with Near-Term Results
Looking ahead, aircraft-makers Boeing (NYSE:BA) and Airbus Group (PA:AIR) both see huge growth in deliveries as the global middle class continues to swell in rank. In its Current Market Outlook, Boeing projects total demand for nearly 40,000 new jets over the next 20 years—a 4 percent increase over last year’s forecast—with a large percentage of the growth occurring in Asia.
Altogether, these deals are valued at a monumental $5.9 trillion.

Airbus’ forecast, while somewhat more conservative, is no less impressive. The French airline manufacturer sees demand for more than 33,000 new aircrafts between now and 2035, all with a market value of $5.2 trillion.
The lion’s share of this expansion is expected to take place in emerging and developing countries such as India and China, where middle class growth is booming. Higher incomes should heat up flight demand and help air traffic double over the next 15 years, according to Airbus. In India alone, air traffic is expected to accelerate fivefold between now and 2035.
The Federal Aviation Administration (FAA) sees the number of global revenue passenger miles rising from 877 billion in 2015 to 1.02 trillion in 2024.

In the near term, domestic airlines continue to trade at extremely low multiples compared to other stocks in the industrials sector. Compare airlines’ price-to-earnings (P/E) ratios to transportation stocks and the broader stock market. Whereas American is trading at a little over 4 times earnings, transportation stocks—which include trucks, railroads and other industrials—trade at more than 14 times earnings. The S&P 500 Index, meanwhile, currently trades at more than 20 times earnings.
Domestic carriers also continue to return money to shareholders in the form of dividends and stock buyback programs. American, for example, repurchased more than 50 million shares, worth $1.7 billion, in the second quarter. As of March, Southwest Airlines Company (NYSE:LUV) had a phenomenal three-year dividend growth rate of 101.2 percent, according to GuruFocus data. This helps support the thesis that the industry offers many attractive buying opportunities right now.
How Regulations Have Hurt Retail Investors
In past weeks and months, I’ve written about how excessive regulations are atrophying global economic growth. Granted, regulations are often well intentioned and necessary to create a level playing field. But when they grow too large in number and scope, it’s a little like having more referees than players on the basketball court.
Here in the U.S., federal regulations cost U.S. businesses more than $1.88 trillion a year. If they were their own economy, American regulations would be the ninth largest in the world, just ahead of Russia. Small businesses, which are responsible for more than half of all U.S. sales and employ 55 percent of all American workers, increasingly rank regulations as one of the top challenges facing their growth and survival.
This isn’t just an American phenomenon, of course. Last month, Brits voted to leave the European Union largely because they recognize overzealous regulation and envy policies as impediments to innovation.
They’re tired of falling behind. Why else did the European Commission recently require American tech giants Netflix (NASDAQ:NFLX) and Amazon (NASDAQ:AMZN) to guarantee that at least 20 percent of their streaming video content is shot in Europe?
Were EU rules not so corrosive to innovation, the continent might have its own Silicon Valley and its own Netflix (and, I might add, more attractive tax incentives to produce movies and TV shows in their countries).
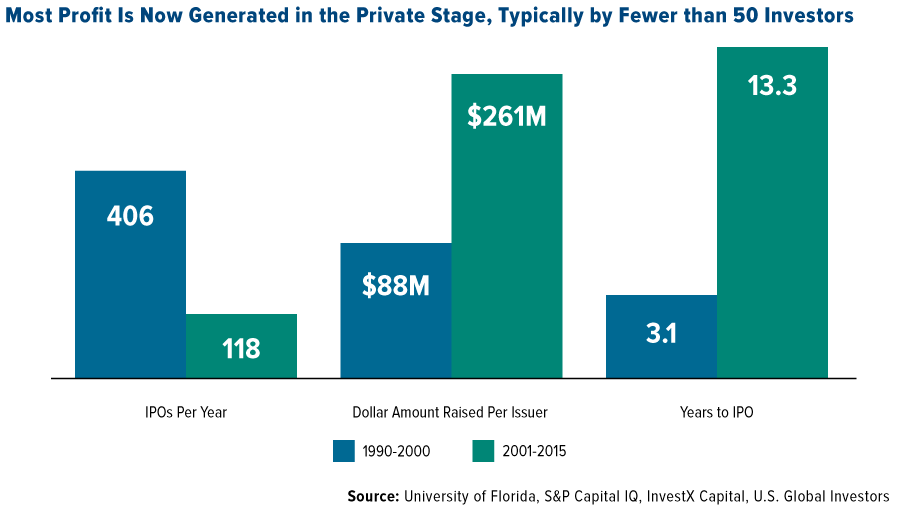
Now, thanks to a slide deck from InvestX Financial CEO Marcus New, it’s clear just how detrimental U.S. regulations have been in the formation of capital. In the years preceding 2001, we could have expected to see 100 new companies on average go public every quarter. Since then, that number has fallen to around 30. Because of the mounting risks involved, the gestation period leading up to an IPO has ballooned from three years to more than 13 years, with an average $261 million raised per issuer, compared to $88 million between 1990 and 2001.
Also because of regulations, smaller retail investors have effectively been blocked from participating in higher-yielding investments—namely, private equity and venture capital, whose 10-year compound annual growth rates have averaged 11.8 and 11 percent, quite a bit more than Treasuries, equities and other common asset classes.

For the most part, only accredited investors—those who have earned income that exceeds $200,000 or a net worth of over $1 million—are permitted to participate. As a result, it’s only the rich who get, well, richer.
Again, these rules are well intentioned. The justification is that everyday investors should be protected from the heightened risks involved in more sophisticated assets. At the same time, many people are being restricted from opportunities that might help them move up the socioeconomic ladder—opportunities that are open only to those who’ve already “made it.”
It seems, then, that the Occupy Movement and other class warriors who criticize and bash the 1 percent for “stealing all the wealth” would do well to direct some of their ire at the socialist rules responsible for restricting their social mobility.
With political uncertainty high, and with fiscal and monetary policies imbalanced, gold remains an attractive asset class. As always, I suggest a 10 percent weighting in gold bullion and gold stocks, with a rebalance either quarterly or annually.
All opinions expressed and data provided are subject to change without notice. Some of these opinions may not be appropriate to every investor. By clicking the link(s) above, you will be directed to a third-party website(s). U.S. Global Investors does not endorse all information supplied by this/these website(s) and is not responsible for its/their content.
The price to earnings ratio (P/E ratio) is the measure of the share price relative to the annual net income earned by the firm per share. The P/E ratio shows current investor demand for a company share. A high P/E ratio generally indicates increased demand because investors anticipate earnings growth in the future.
There is no guarantee that the issuers of any securities will declare dividends in the future or that, if declared, will remain at current levels or increase over time.
The S&P 500 Stock Index is a widely recognized capitalization-weighted index of 500 common stock prices in U.S. companies. The S&P Transportation Select Industry Index represents the transportation sub-industry portion of the S&P Total Stock Market Index.
Holdings may change daily. Holdings are reported as of the most recent quarter-end. The following securities mentioned in the article were held by one or more accounts managed by U.S. Global Investors as of 3/31/2016: American Airlines Group, Delta Air Lines Inc (NYSE:DAL)., United Continental Holdings Inc., Southwest Airlines Co., The Boeing Co., Airbus Group (PA:AIR) SE, Barclays Bank PLC.
U.S. Global Investors, Inc. is an investment adviser registered with the Securities and Exchange Commission ("SEC"). This does not mean that we are sponsored, recommended, or approved by the SEC, or that our abilities or qualifications in any respect have been passed upon by the SEC or any officer of the SEC.
This commentary should not be considered a solicitation or offering of any investment product.
Certain materials in this commentary may contain dated information. The information provided was current at the time of publication.