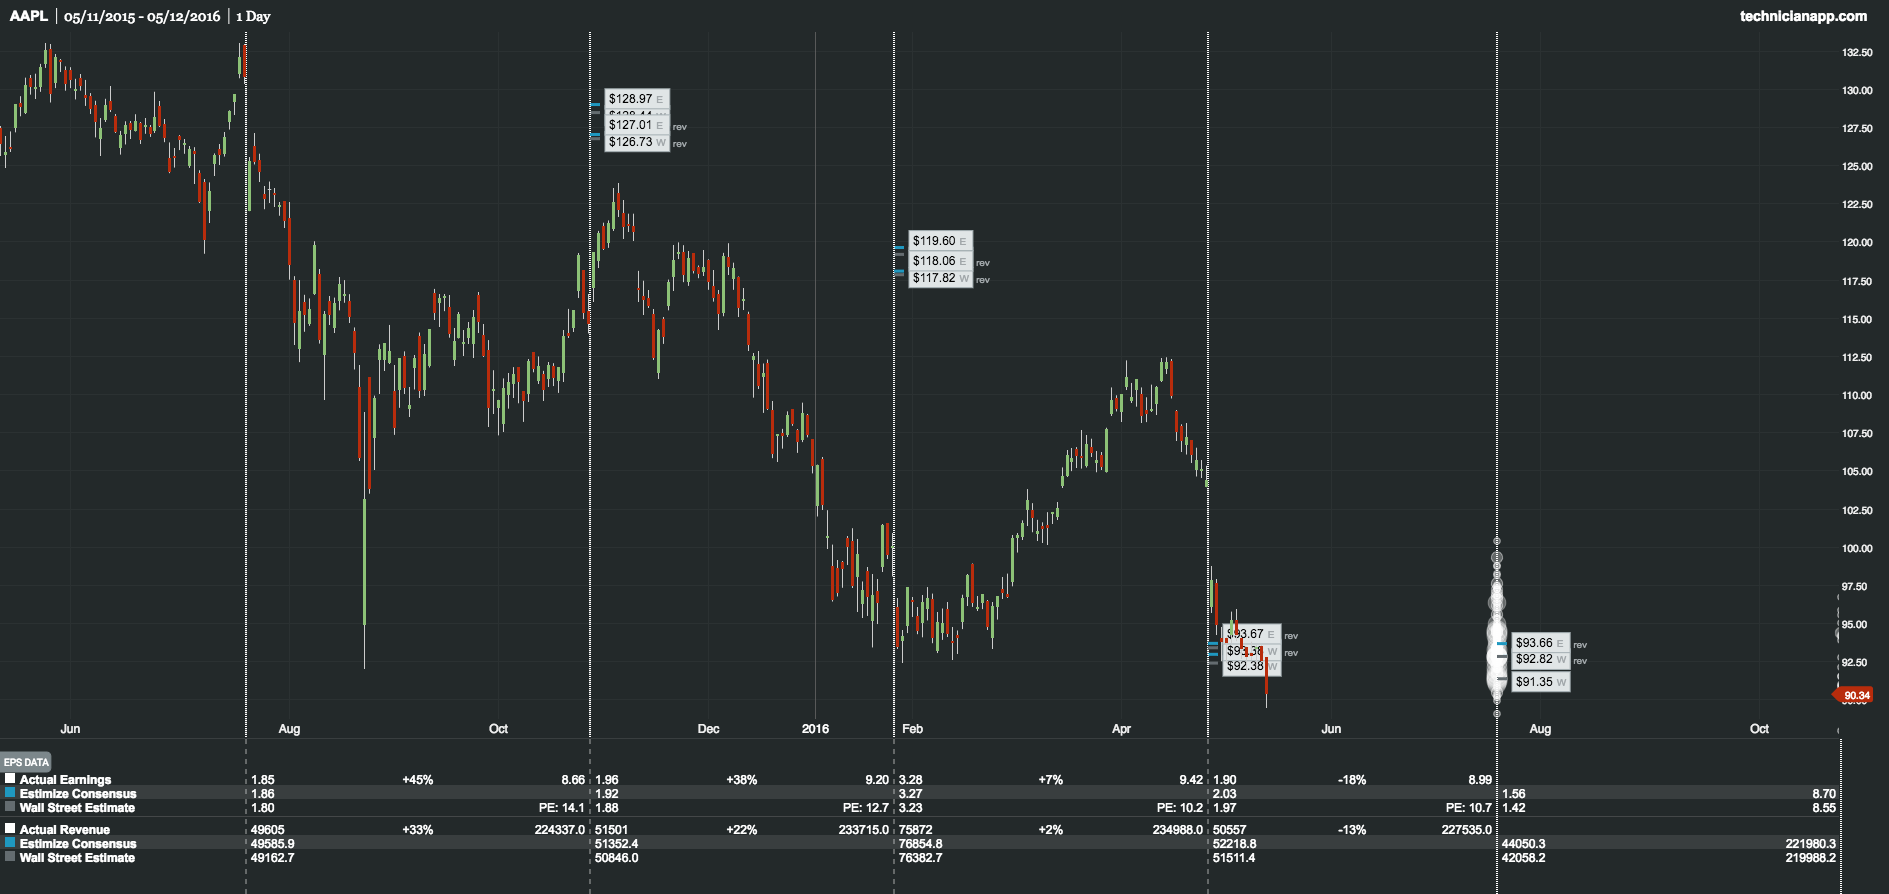
A long-held cult favorite on Wall Street, Apple Inc (NASDAQ:AAPL) has hit a few road bumps in 2016. Just today, shares of the tech giant slid under $90 for the first time in 2 years. Apple’s current losing streak is approaching 10 days now and with more negative reports coming out, the worst may be yet to come.
The company’s latest earnings featured shrinking revenue for the first time in 10 years primarily due to underwhelming iPhone sales. Given that the iPhone accounts for ⅔ of revenue, there is little room for misses when it comes to phone sales.
Guidance from Apple’s suppliers are a great indicator of future iPhone sales. During the last 2 quarters, as iPhone sales began to slow, major suppliers were the first to feel the effect. As a result, semiconductors including Cirrus Logic Inc (NASDAQ:CRUS), Qorvo Inc (NASDAQ:QRVO) and Skyworks Solutions Inc (NASDAQ:SWKS), all of which produce chips or wireless solutions in the iPhone, posted weak sales numbers.
Earlier today, Taiwan Semiconductor Manufacturing (NYSE:TSM) Apple’s main chip supplier, guided for a terrible second half of 2016. Peak season shipments are expected to fall from the highs of the past few years. If Apple is cutting chip orders, as this report suggests, it could mean a full year of disappointments.
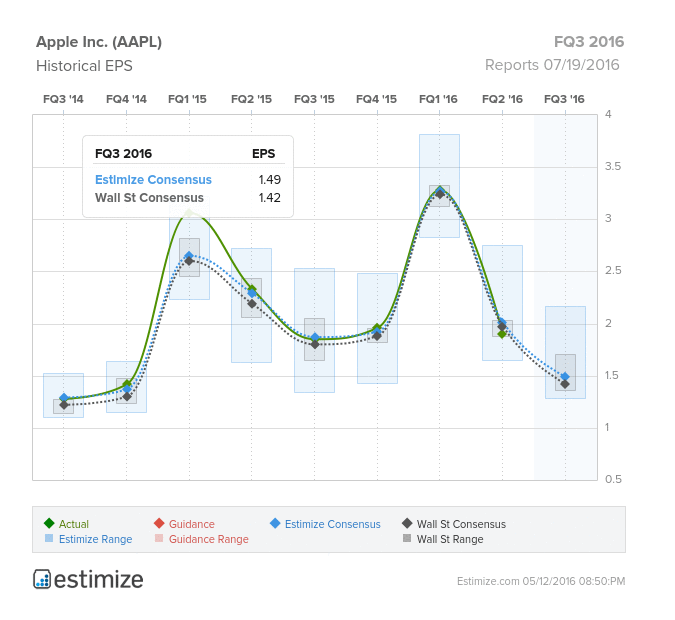
Apple’s own guidance during the Q2 earnings call was just as bad, calling for Q3 revenues in the range of $41 - 43 billion, well below what analysts were expecting. Those sales levels predict roughly 42 million iPhone unit sales, which would be a decline from the 47.5 reported in the June 2015 quarter. The Estimize consensus is looking for earnings per share of $1.49 on nearly $43 billion in revenue.
Compared to a year earlier this reflects a 16% loss on the bottom line coupled with a double digit decline on the top. Estimates have already come down considerably in the past month and should fall even further as we approach the July report date.

Applying Apple’s current multiple to expected earnings makes the case that shares will continue to take a beating for the foreseeable future. The Estimize data forecasts a target price just above $90 following Q3 earnings based on the P/E of 10x. As estimates continue to be revised downward on news from chipmakers, the target price will follow suit.
Historically, this has proven fairly accurate. Ahead of Q2 earnings, forward earnings estimates had targeted $93 per share even though Apple was trading above $110 at the time. Yet 3 days after earnings, Apple shares (NASDAQ:AAPL) slid to $93 on the dismal results. Apple shares will remain under pressure until the company can prove it’s ability to stimulate growth once again.
Do you think AAPL can beat estimates?

