One of the most controversial elements of President Obama’s 2014 budget is the proposal to reduce future cost-of-living adjustments to Social Security benefits by changing the inflation index. The Social Security Administration now bases inflation adjustments on the consumer price index for urban wage earners and clerical workers (CPI-W), a close cousin of the more widely publicized CPI for all urban consumers (CPI-U). The administration proposal would instead use a relatively new index called the chained CPI, or C-CPI-U, which, in the past, has increased slightly less rapidly. Predictably, deficit hawks love the idea, while seniors and those who defend their interests, hate it. Suppose, though, that we set ideology and interest group politics aside to look at the underlying economics of the issue. On those terms, is the switch to the chained CPI the right fix for Social Security?
What exactly are we trying to fix?
Before we start fixing something, we should be sure we know what is broken. Is a flawed method of inflation adjustment really a major problem? Would fixing it, in isolation, really improve the functioning of the Social Security system as a whole? Or is it just an attempt to disguise an unpalatable cut in benefits as a minor technical correction? If what we really want is an across the board cut, why?
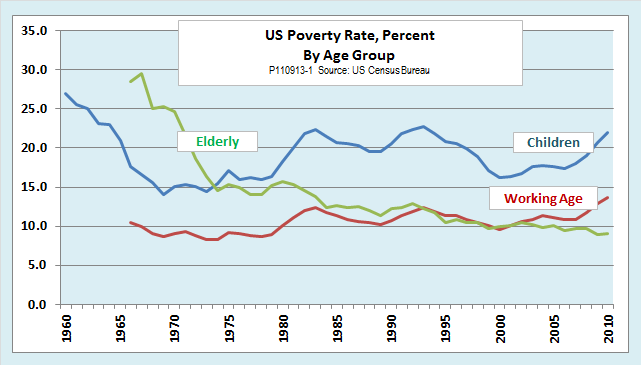
It is sometimes argued that we can afford to slow the growth of Social Security benefits because seniors are no longer as economically disadvantaged as they once were. Consider, for example, the dramatic decrease in poverty rates among the elderly over the past half century. As the following chart shows, in the 1960s, when the government first began to publish official poverty statistics, people 65 and older had the highest poverty rates of any age group. Today they have the lowest rate.
Taken at face value, these trends appear be consistent with the notion that seniors have more than kept up with inflation. However, a closer look at the income status of older Americans raises some doubts about that. One difficulty is that the official approach to measuring poverty probably overstates the standard of living of seniors.
The shortcomings of the official poverty measure are well known. In its original form, it simply multiplies the cost of an economy food plan by three. As a result, it fails to take into account the increasing relative prices of budget elements other than food, the impact of taxes, and the value of in-kind government benefits like SNAP (formerly food stamps), Medicare, and Medicaid. Other problems include inadequate attention to regional differences in living costs and an inadequate view of family structure.
Two years ago, the Census Bureau introduced a new Supplementary Poverty Measure (SPM) that tries to address these problems.The SPM begins from a minimum budget that includes not just food, but food, shelter, clothing, and utilities (FCSU). The FCSU budget is then multiplied by 1.2 to allow for other expenditures, and it is further adjusted for family size and regional differences in housing costs. The SPM then compares the resulting minimum family budget to a measure of resources that adjusts the old cash income concept in three ways. First, it adds the value of in-kind benefits that families can use to meet FCSU needs. Second, it subtracts net taxes. Third, it subtracts other necessary expenses, of which out-of-pocket medical expenses are one of the largest.
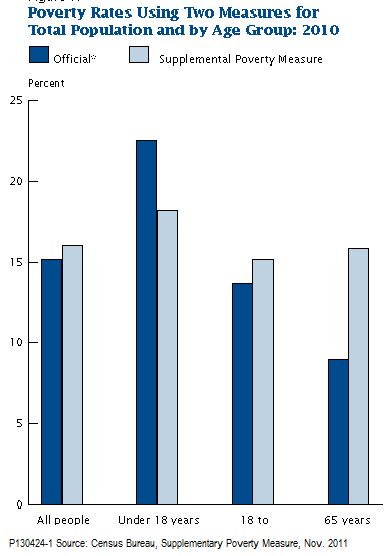
As the next chart shows, the SPM increases the estimated poverty rate for the whole population only modestly, from 15.2 percent to 16 percent for 2010. However, the impact varies widely by age group. In particular, the poverty rate for people aged 65 and older jumps from 9 percent to 15.9 percent, which is close to the average for the population as a whole. A large part of that increase comes from the way it takes into account out-of-pocket medical expenses that reduce household income available to meet FCSU needs. 
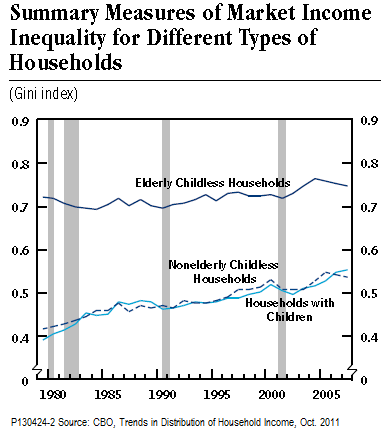
A poverty rate for seniors no lower than that for the population as a whole already undermines the case for less generous cost-of-living adjustments to Social Security, but there is more. We should look not just at the poverty rate among seniors, but at the entire distribution of income for the elderly population. According to CBO data, presented in the next chart, that distribution is far less equal than for the rest of the population, and, as for other age groups, it is becoming even more unequal over time.
The chart shows Gini indexes for various population groups based on market income, a measure that does not include Social Security or other government benefits. A higher value of the Gini index means more inequality. The picture we get is of an elderly population in which a relatively few wealthy households account for most of the market income, while many of the rest are highly dependent on Social Security benefits.
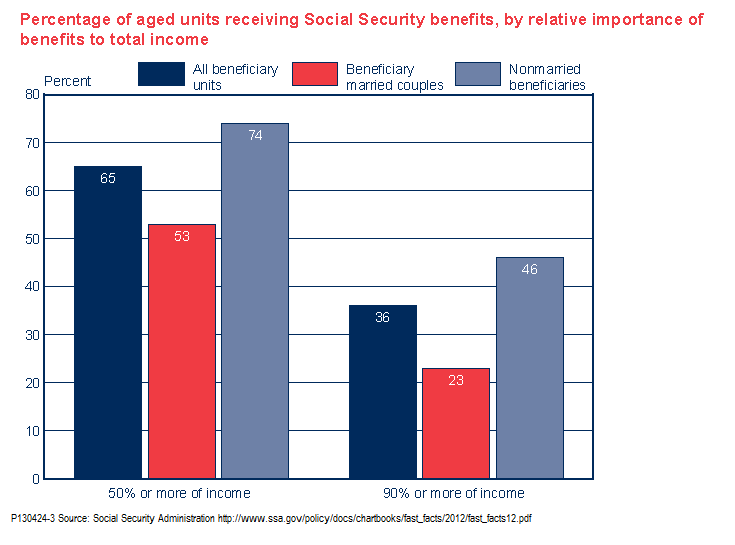
That picture is confirmed by data from the Social Security Administration, presented in the next chart, that show that a third of the elderly population depend on Social Security for 90 percent of their income, and two-thirds for half or more of their income. For the single elderly, the degree of dependence on Social Security is even greater.
Taken together, these data suggest that an across-the-board benefit reduction, whether by way of a switch to the chained CPI or in any other form, would further aggravate the already unequal distribution of income among seniors. To offset that tendency, the administration budget proposal offers “bump-ups” for retirees older than 75, but the bump-ups may not help low-income retirees as much as is sometimes supposed. The problem is that people with lower incomes are much less likely than those with higher incomes to live long enough to reach the bump-up age. For example, for men reaching retirement age of 67 in 2006, the life expectancy is five and a half years less for those in the lower half of the income distribution than for those in the top half. That means many of the poorest retirees will die before their get their first bump-up. (The same problem also affects proposals to lower Social Security costs by raising the retirement age, as discussed in this earlier post.)
Any way we look at it, then, it appears that a shift to the chained CPI, with or without bump-ups, would make the already unequal distribution of income among seniors more unequal still. Overcoming that problem would require more far-reaching reforms to the Social Security benefit structure, for example, one that combined a guaranteed minimum benefit at least equaling the poverty level with means testing of benefits for wealthier seniors.
How good is the chained CPI?
Let’s look at the matter from a different perspective now. Regardless of what we do about total Social Security benefit levels, caps, and floors, benefits will, like those of other income support programs, need some kind of inflation adjustment. On purely methodological grounds, what reasons do we have to think that the chained CPI is better than the CPI-W?
What we would really like to have as a basis for inflation adjustment is a true cost of living index (COLI). A COLI would measure the amount of income we need to reach a certain level of consumer satisfaction. If the COLI rose by 3 percent, and your benefits went up from $1,000 a month to $1,030 a month, then we could truly say that you were no better or worse off than before. Unfortunately, though, a true COLI is a purely theoretical construct that we can only approximate in the real world.
The approximations we do have are price indexes–averages of the prices of the various things we consume, weighted by the quantity of each item in our market basket of goods and services. Economists have long argued that price indexes like the CPI in its various forms tend to overstate the rate of increase of the cost of living. Some of the more important sources of upward bias in the CPI are these:
- A substitution bias, which arises from the fact that changing prices cause consumers to shift, over time, from goods whose prices increase faster than average to those that increase more slowly than average, or fall.
- A quality bias, which arises from the fact that new models of a good have better performance (like flat-screen TVs) or last longer (like radial-ply tires), and therefore give additional satisfaction that partly or fully offsets price increases. Closely related factors, like the introduction of completely new goods and new, lower-cost methods of retailing add to the quality bias.
- A small sample bias, which is a purely technical distortion arising from the fact the BLS makes only a few price observations for each good or service each month.
(Note: These three sources of bias and all of the discussion that follows concern the measurement of inflation. In addition, there are strong biases in people’s subjective perceptions of inflation. Many people are skeptical of the idea that published price indexes overstate inflation because they, personally, perceive a much higher rate of inflation than measured by the CPI. The more paranoid among them believe that the government is purposely manipulating the data in a way that understates the true inflation rate. For a detailed discussion of the upward bias in perceived inflation, see this earlier post.)
In the 1990s, Congress appointed a panel of economists, known as the Boskin Commission, to study the accuracy of the CPI. The commission estimated the upward bias of the CPI-U to be about 1.1 percentage points per year and made several recommendations for mitigating it. Since that time, the Bureau of Labor Statistics has implemented a number of those recommendations. For example, it has significantly reduced the substitution bias by updating base-year quantity weights more frequently. Also, it has introduced new methods of correcting for changes in the quality of goods, and it pays more attention to outlet stores and online retailing. As a result, the upward bias of the CPI is almost certainly less than it was in the 1990s, but it may still be as much as one-half to a full percentage point per year. (See here and here for some recent discussions.)
There are strong theoretical reasons for thinking that the chained CPI further reduces the substitution bias. The reason is that it takes into account quantities consumed in the current period, when prices are measured, rather than just quantities consumed in the past. Both theoretical considerations and experience with the C-CPI-U since the BLS began to calculate it in 2000 suggest that the reduction in the substitution bias is in the range of 0.2 to 0.3 percentage points per year. However, that does not automatically make the chained CPI an ideal basis for indexing Social Security benefits. It has problems of its own.
One problem as that the data on current consumption patterns needed to calculate the chained CPI are available only with a lag. The first version of the C-CPI-U released each month is only an estimate based on extrapolations from past data. Social Security benefits would have to be adjusted using a preliminary calculation of the chained CPI rather than the final revision.
A more serious problem is that the quantity weights used for both the CPI-U and the C-CPI-U do not necessarily reflect the consumption patterns of Social Security beneficiaries. Beneficiaries are much older, on average, than the population as a whole; they are likely to drive less, use more medical care, and perhaps differ in other ways as well from the general population.
Conceptually, it would be better to adjust Social Security benefits using a price index specially tailored to the consumption patterns of the people receiving them. With this in mind, the BLS has experimented with a separate consumer price index for the elderly population, known as the CPI-E. Although there are several methodological issues to be resolved before the CPI-E is ready for the big time, preliminary results suggest that it has been rising at a rate about 0.2 percentage points faster than the CPI-W, in large part because of the greater weight it puts on healthcare goods and services.
Arguably, a chained version of the CPI-E would be an even better basis for inflation adjustment of Social Security. The BLS has not yet tried to calculate such an index, but if the substitution bias for the CPI-E is about the same as it is for the CPI-U, a chained CPI-E would probably rise about 0.2 to 0.3 percentage points more slowly than the unchained version. That means that when we take into account the offsetting effects of the substitution bias and the differences in consumption patterns between elderly and younger consumers, it could well turn out that the CPI-W, as now implemented, is a better approximation to a COLI for senior citizens than the C-CPI-U.
The bottom line
When all is said and done, the economic arguments for switching from the CPI-W to the chained CPI for inflation adjustment of Social Security benefits is a good deal weaker than it is often represented to be. We cannot really be confident that the chained CPI is a better approximation to changes in the cost of living of the elderly population than the CPI-W. In addition, switching to the C-CPI-U without adjusting benefit floors and caps could very well increase the inequality of income distribution among the elderly, which is already greater than for the population as a whole.
The fact is, the proposal to switch Social Security to the chained CPI has much more to do with politics than with economics. In the current phase of the budget debate, the White House appears eager to assume the role of the reasonable party by offering to cut entitlements, in order to set up a contrast with a conservative opposition that is unwilling to consider even small increases in revenue. The administration apparently hopes that it can minimize the backlash from its core supporters by passing off the C-CPI-U a purely technical adjustment.
It is not likely to work. My advice would be to forget about changing inflation adjustments for Social Security until the political climate allows consideration of a more comprehensive set of entitlement reforms. Use of the C-CPI-U or some similar chained price index might eventually make sense as part of broader reform package, but as a stand-alone measure, it offers little to love.
Original post
