After the early 2021 Cannabis rally, lead by Reddit and other speculators, the past 90+ days of price activity in this sector has resulted in a narrowing consolidation/momentum base setup. Just last week, many Cannabis symbols broke above a downward sloping price channel that suggests a new bullish price wave/phase is setting up. It is very likely that this new bullish price phase may extend into a multi-wave price rally over the next 6+ months where some symbols may rally 30 to 60% or more.
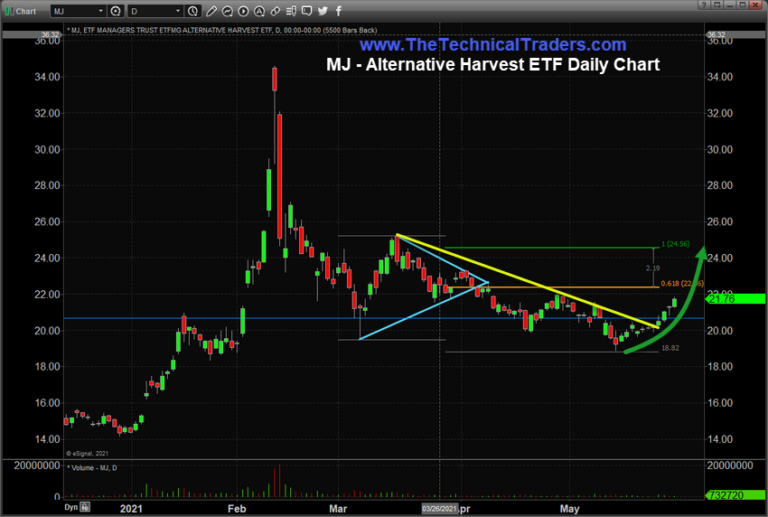
Alternative Harvest ETF Breaks Downtrend – Targeting $24.50 (+30% From Recent Lows)
This Daily MJ chart highlights the type of upward price rotation we are seeing across many Cannabis stock symbols. The extended downtrend from mid-February till the early May lows has now been broken with bullish price trending. It is the opinion of my team and I that this rally may continue to extend higher in multiple advancing waves – eventually pushing the Cannabis sector price levels well above our initial target levels.
I am using a simple Fibonacci Extension (or Measured Move) technique to identify initial price targets, focusing on the initial recovery attempt from early to mid-March 2021 in most cases. We believe this range represents an accurate attempt at a breakout price rally phase resulting from the current momentum base setup in mid-May. If our research is correct, MJ may attempt to rally to $22.40 then $24.50 before stalling and attempting to briefly Flag sideways. We may see a further wave of price advancement after this initial bullish price phase completes – indicating that this could be the start of a much bigger upside price trend.

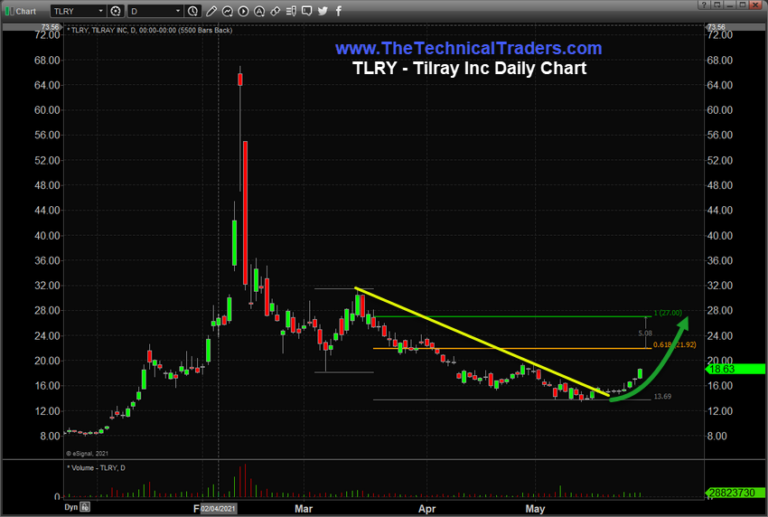
Tilray May Rally Over 100% If This Rally Continues To Our Extended Targets
This Daily Tilray (NASDAQ:TLRY) chart highlights a similar breakout/momentum base pattern. Notice how TLRY consolidated in a very similar price range to MJ and extended the momentum base level, near $13.50 to $14.00, for almost 30 days before finally breaking above the YELLOW downward sloping price channel. This extended downward/sideways price trend, lasting more than 70 days, suggests any potential upside price breakout may last at least 35 to 45 days before running into any substantial resistance (roughly 50% to 61% of the consolidation range).
Again, from a technical standpoint, I am using the Fibonacci Price Extension (Measured Move) technique to attempt to pinpoint potential upside price targets. We believe the initial upside price targets in TLRY are $21.65 and $26.70. Beyond these levels, we expect a moderate consolidation in price after these targets are reached that may set up a subsequent multi-wave price advance to levels beyond $30 to $35. These upside targets represent a substantial +100% to +145% from recent lows.

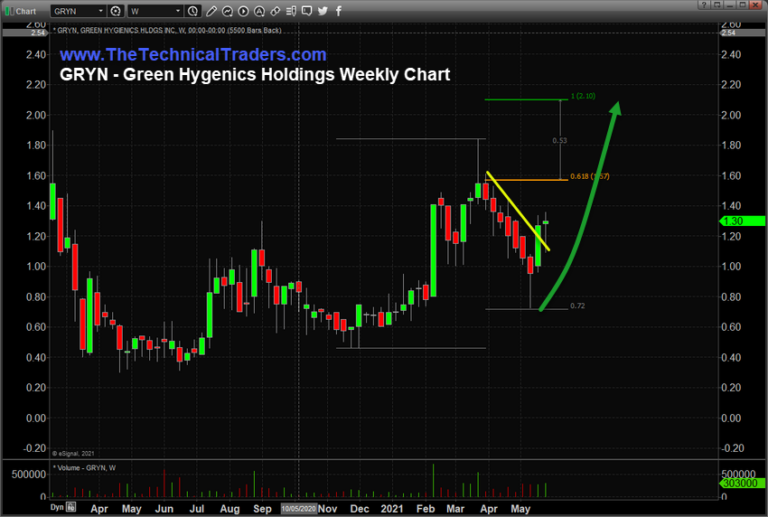
Green Hygienics May Be Going GREEN With A Big Rally Attempt
Lastly, a uniquely positioned Hemp production company with US FDA approval for their product, Green Hygienics (OTC:GRYN), is illustrated here on a Weekly chart basis. We believe this chart exhibits a similar type of price pattern related to the recent bullish breakout within the Cannabis sector. Additionally, the potential for a multi-wave bullish price rally using our Fibonacci Measured Move targeting system suggests GRYN may attempt to target $2.10 to $2.25 fairly quickly as this rally attempt continues. This represents a +190% rally from recent lows and a +60% opportunity from current price levels. Any subsequent multi-wave advancement may target levels near $2.90 to $3.40 – representing a +120% to 160% rally phase.

The strength and opportunities within this sector are the Consumer Cannabis Use and the Alternative Medical Use solutions. As this sector continues to grow throughout the world, we are confident that some consolidation via acquisitions and broader market consolidations will take place, leaving the strongest and most adept players still standing. Medical use will likely become the biggest component of this industry. This is where new uses and solutions may attempt to help solve perplexing issues and help to restore more active lifestyles for many people throughout the world. PTSD, Bi-Polar and other debilitating issues are being treated with Cannabis, CBD, and other micro-dosing solutions that starting to show good results.
It is just a matter of time before this industry consolidates into bigger, powerhouse companies that address work towards solutions for both high-quality, FDA approved, consumer and medical use solutions. This industry is still in its infancy in terms of long term growth potential. Catching a smaller portion of this initial rally phase may lead to some great longer-term trades.
