🚀 AI-picked stocks soar in May. PRFT is +55%—in just 16 days! Don’t miss June’s top picks.Unlock full list

Is S&P 500 Just Starting Its Run To 3000?

Published 05/30/2018, 07:28 AM
Updated 07/09/2023, 06:31 AM
US500
-

With the index more than 150 points higher from the 2018 lows, after breaking out of a consolidating triangle, sentiment (thanks to Italy) is very bearish equities (at least from my point of view). Elliott wave wise I have previously mentioned this triangle scenario and that the entire consolidation could be a huge wave 4. I believe that it is more probable to say that this triangle is complete and that we already have started to make an impulsive wave higher.
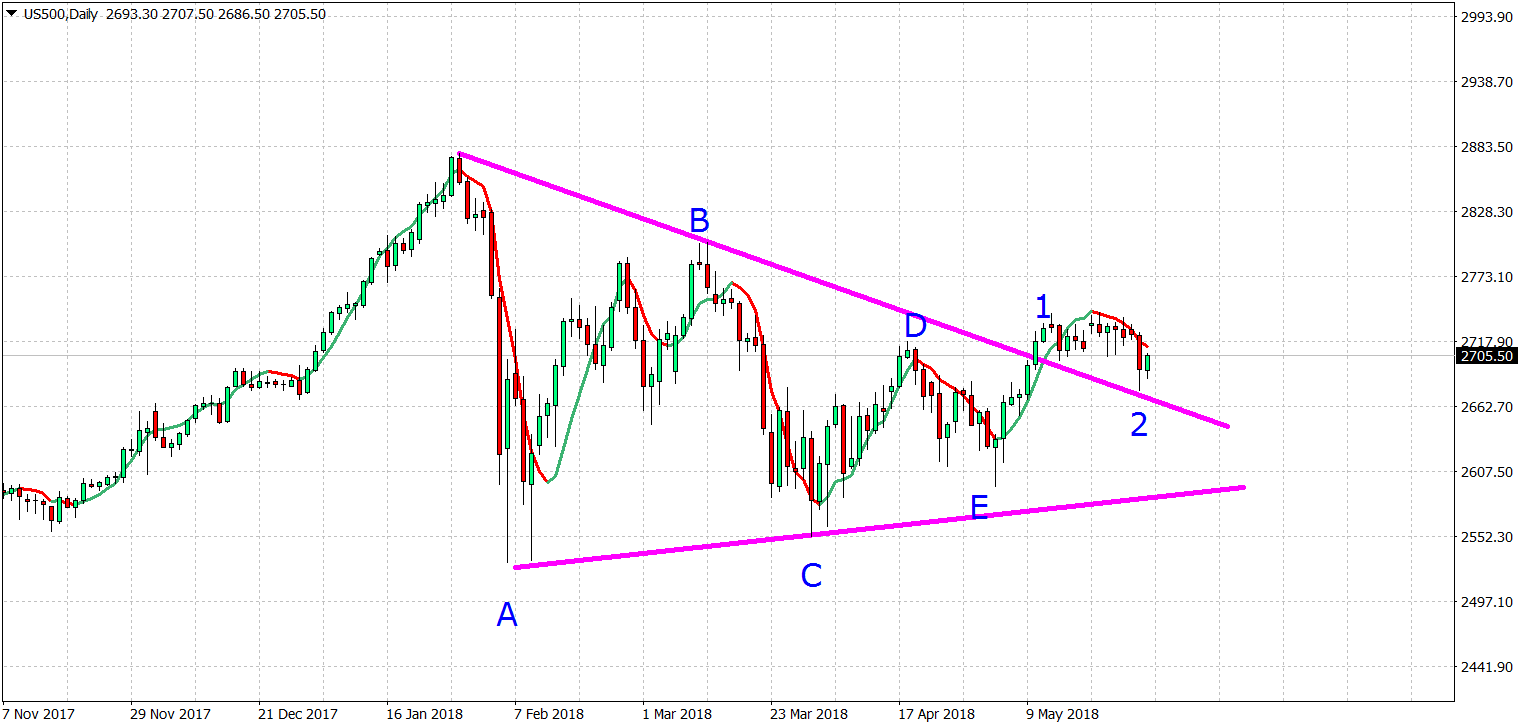
US500 Daily Chart

I believe we are currently in wave 2 and there are many chances it is also complete. Price back tested the broken triangle. If S&P 500 moves below 2685 then wave 2 is not over.
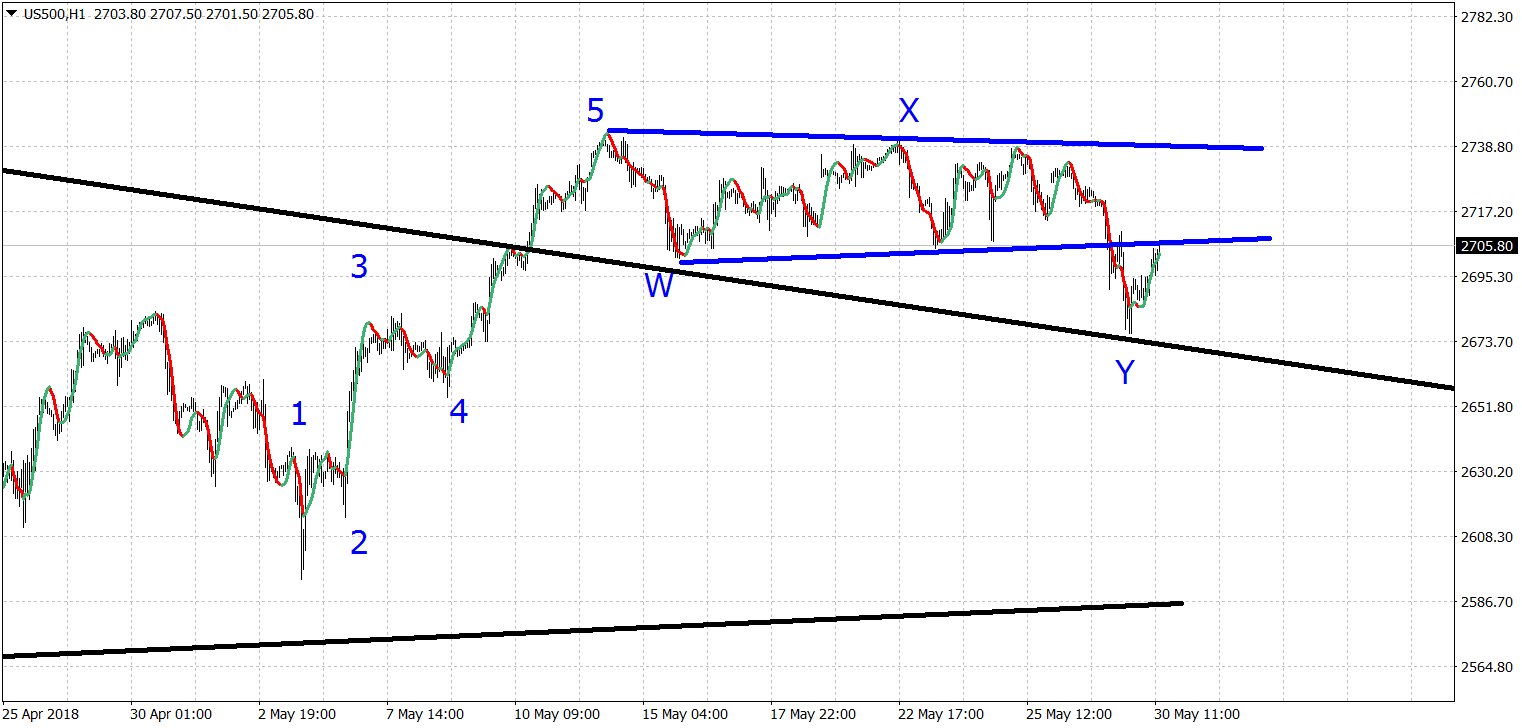
US500 1 Hour Chart

A break above 2740 will confirm wave 2 is over and we are starting wave 3 higher of the first impulsive wave. According to this wave count I see S&P 500 hitting new all time highs this summer.

SPX Monthly Chart

The 2610 level remains key for this scenario to come true. Even with a more complex correction, I can only see S&P 500 fall to 2630-2650 max. Bulls do not want to see 2610 support being broken. If this happens, then the 23.6% Fibonacci retracement in the monthly chart as shown above will be our first target. Until then I remain bullish.

Disclosure: None of the information or opinions expressed in this blog constitutes a solicitation for the purchase or sale of any security or other instrument. Nothing in this article constitutes investment advice and any recommendations that June be contained herein have not been based upon a consideration of the investment objectives, financial situation or particular needs of any specific recipient. Any purchase or sale activity in any securities or other instrument should be based upon your own analysis and conclusions.

Latest comments

Loading next article…
Risk Disclosure: Trading in financial instruments and/or cryptocurrencies involves high risks including the risk of losing some, or all, of your investment amount, and may not be suitable for all investors. Prices of cryptocurrencies are extremely volatile and may be affected by external factors such as financial, regulatory or political events. Trading on margin increases the financial risks.
Before deciding to trade in financial instrument or cryptocurrencies you should be fully informed of the risks and costs associated with trading the financial markets, carefully consider your investment objectives, level of experience, and risk appetite, and seek professional advice where needed.
Fusion Media would like to remind you that the data contained in this website is not necessarily real-time nor accurate. The data and prices on the website are not necessarily provided by any market or exchange, but may be provided by market makers, and so prices may not be accurate and may differ from the actual price at any given market, meaning prices are indicative and not appropriate for trading purposes. Fusion Media and any provider of the data contained in this website will not accept liability for any loss or damage as a result of your trading, or your reliance on the information contained within this website.
It is prohibited to use, store, reproduce, display, modify, transmit or distribute the data contained in this website without the explicit prior written permission of Fusion Media and/or the data provider. All intellectual property rights are reserved by the providers and/or the exchange providing the data contained in this website.
Fusion Media may be compensated by the advertisers that appear on the website, based on your interaction with the advertisements or advertisers.
© 2007-2024 - Fusion Media Limited. All Rights Reserved.