Get 40% Off
🚨 Volatile Markets? Find Hidden Gems for Serious Outperformance
Find Stocks Now

Is Oracle's South Move A Sign Of Correction?

Published 08/09/2019, 10:43 AM
Updated 07/09/2023, 06:32 AM

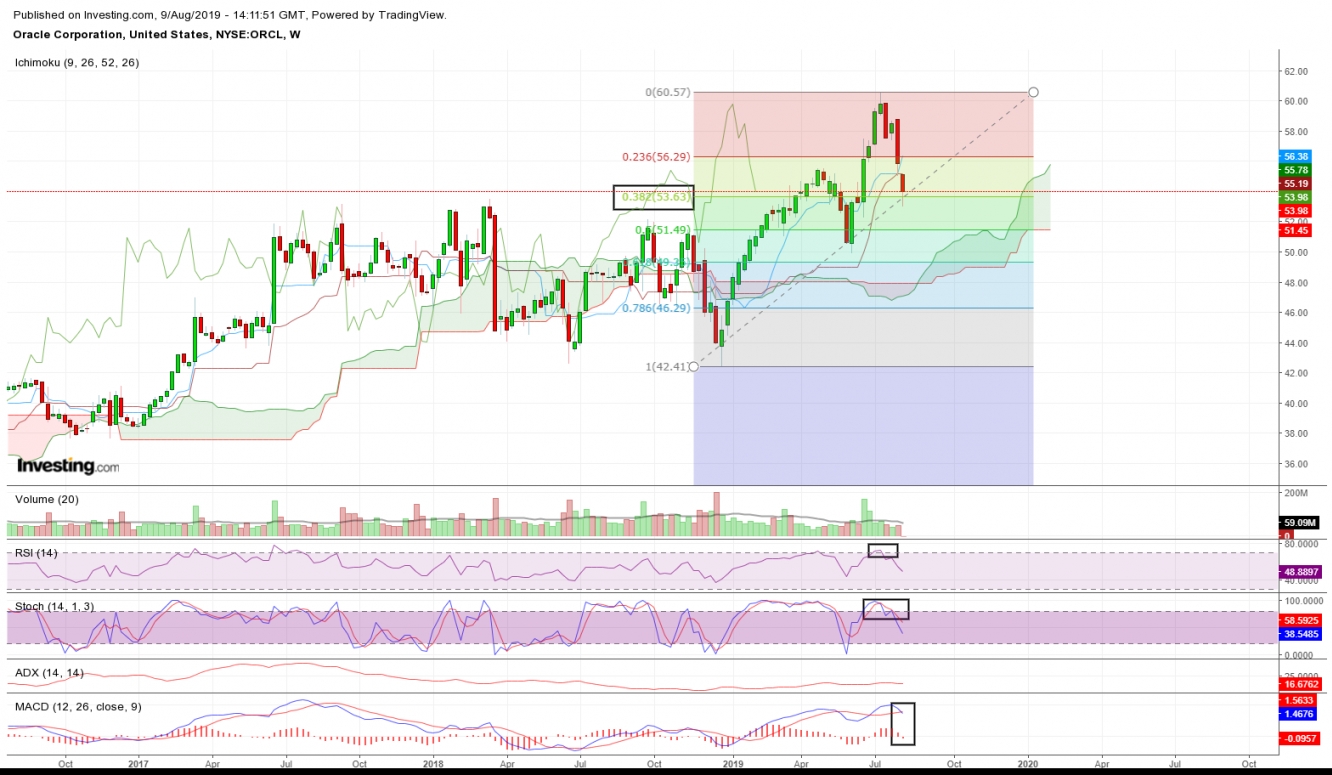
Oracle Corporation's (NYSE:ORCL) recent downward move may be just a corrective move, after successive bullish moves since late December 2018 until it reached its peak ($60.50) on the week of July 8, 2019 with declining momentum as depicted by the ADX indicator of below 25.

Whenever an ADX reading is below 25, it's better to use Oscillators as a guide on the likely price action to come. We need to watch closely the OB (Over Bought) signal triggered by the RSI and/or Stochastics indicator. Price will likely make a correction or head south whenever RSI and/or the Stochastics indicator hit the OB level, and lean under this OB level. From the weekly chart of ORCL, we can also observe MACD just started to cross-over downward with its histogram moving below the zero line, which further indicates the price action making a corrective move. It should be noted that MACD is a lagging indicator and the signal given is usually not as fast as the RSI or the Stochastic.

The current price action as of the end of this week would potentially lead to a bounce, as it just touched the Fibo 38.2% level at $53.63. This is may be supported by the recent recovery of the Dow and the S&P 500. Using the Ichimoku cloud analysis, the overall price action of ORCL may suggest the corrective move, as the price still sits above the cloud and the future cloud still being bullish.

As a sample trading strategy, buy above $54.75 (the high of the candle on Aug 8) with a stop just below $52.97 (the low of the candle on Aug 7) risking $1.78. Place a long target with at least reward risk ratio of 2:1 at $58.31.
3rd party Ad. Not an offer or recommendation by Investing.com. See disclosure here or remove ads .
A Price Bounce At 38.2% Fib May Signal Corrective Price Action

Latest comments

Risk Disclosure: Trading in financial instruments and/or cryptocurrencies involves high risks including the risk of losing some, or all, of your investment amount, and may not be suitable for all investors. Prices of cryptocurrencies are extremely volatile and may be affected by external factors such as financial, regulatory or political events. Trading on margin increases the financial risks.
Before deciding to trade in financial instrument or cryptocurrencies you should be fully informed of the risks and costs associated with trading the financial markets, carefully consider your investment objectives, level of experience, and risk appetite, and seek professional advice where needed.
Fusion Media would like to remind you that the data contained in this website is not necessarily real-time nor accurate. The data and prices on the website are not necessarily provided by any market or exchange, but may be provided by market makers, and so prices may not be accurate and may differ from the actual price at any given market, meaning prices are indicative and not appropriate for trading purposes. Fusion Media and any provider of the data contained in this website will not accept liability for any loss or damage as a result of your trading, or your reliance on the information contained within this website.
It is prohibited to use, store, reproduce, display, modify, transmit or distribute the data contained in this website without the explicit prior written permission of Fusion Media and/or the data provider. All intellectual property rights are reserved by the providers and/or the exchange providing the data contained in this website.
Fusion Media may be compensated by the advertisers that appear on the website, based on your interaction with the advertisements or advertisers.
© 2007-2024 - Fusion Media Limited. All Rights Reserved.