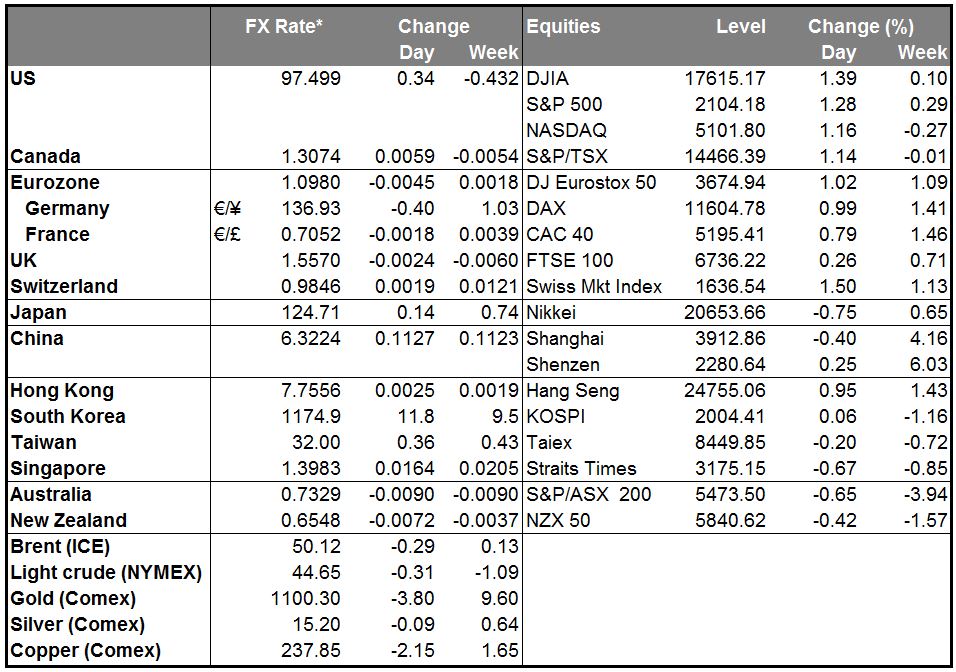
• Commodities rally, but not all commodity currencies The big move yesterday was in the commodities market, where many commodities from oil to copper rallied. There must have been some change in view towards the asset class as a whole, but it doesn’t seem to have been due to a change in the overall macro picture. Rather, there were individual stories for several commodities, which probably spilled over into other commodities as well. For example, oil rose after China’s crude oil imports rose to a record, easing fears that demand for energy – and other commodities -- there is slipping. Rains in Chile halted work at some of their copper mines, while excessive moisture is threatening US crops. However, don’t look for a long-lasting change in direction; all the precious metals and most of the energy futures are below their New York close now, while about half the agricultural commodities are lower too, after China revalued the CNY lower.
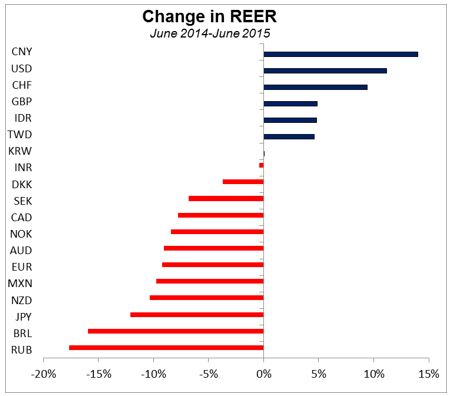
• Revaluation of CNY hits NZD and AUD The People’s Bank of China (PBOC) cut the central rate for USD/CNY by 1.86% to 6.2298, the largest devaluation in two decades. It said the move was a one-time adjustment because the currency’s effective exchange rate – that is, its exchange rate against all the country’s trading partners, not just the US – was stronger than other currencies. That certainly is true, although it’s probably due to a combination of A) weakness in other currencies and B) the PBOC pegging CNY largely against the dollar, which has been strong. Using the BIS’s measures of Real Effective Exchange Rates (REERs), China’s currency appreciated by 14%, the most of any major currency in the year to June (the latest data available).
• It’s quite likely that the larger-than-expected fall in exports in July that was announced over the weekend had something to do with the move. I’ve been saying for some time now that the slowdown in global trade, plus the deflationary pressures from falling commodity prices (which themselves may be just a symptom of falling demand, too) would be likely to restart the “currency wars.” Now we have the first shot fired. Although China said this was a one-off move, other countries are likely to be wary. Who will be first to react? South Korea has a Monetary Policy Committee meeting on Thursday. The country cut its policy rate back in June but kept it steady in July. All 16 economists polled on Bloomberg expect them to keep it unchanged at this week’s meeting, but following the Chinese move, for how long? We may also start to hear less from Japanese officials about how the weak yen may be hurting consumers and more about how it helps to spur exports, which are finally starting to revive there.
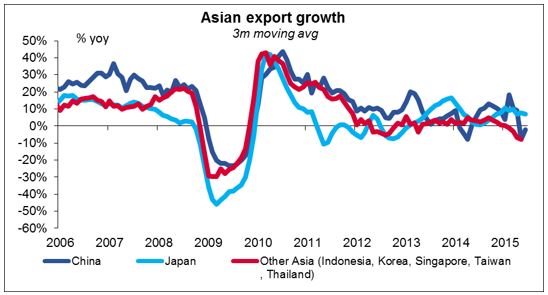
• China’s move is a big negative for the currencies of countries that sell to China and those that compete with it in third countries. This includes Australia, New Zealand, South Korea, Japan and the other Asian countries. Note that emerging Asia as a whole is doing no better than China in the export department, either. The weaker CNY may make life more difficult for the Eurozone as well. Total EU trade with China amounted to $638bn in 2014, only slightly less than trade with the US ($655bn). It also helps China to export deflation around the world. I doubt if it will derail the Fed’s plans to tighten, but it may well slow the pace of their tightening. It could have a bigger impact on the actions of the Bank of England, where the mandate is focused entirely on inflation.
• EUR/CHF hits post-floor high I mentioned yesterday morning that EUR/CHF had challenged the highs set since Switzerland dismantled the CHF floor back in January. The pair broke through that level in yesterday’s trading and moved higher. The weakening of this safe-haven currency may be due to Swiss investors moving funds out in search of higher yield – indeed, in search of some yield. There may also be a recovery of confidence now that Chinese stocks seem to have bottomed. CHF has been out of the spotlight recently, but I think it could come back into fashion again as a funding currency, given how nicely investors are paid to borrow CHF (three-month CHF is around -0.73%.)
• Today’s highlights: During the European day, the highlight will be the German ZEW survey for August. The survey for July added to the weak data coming out from the country, with the expectations index declining and only a modest increase in the current situation index. Now, however, with the Greek crisis and Grexit risk having diminished, we could see an improvement in expectations towards the end of Q3. This may offset the recent soft data and will most likely keep alive the scenario that the Eurozone recovery could start to gather momentum again. EUR could strengthen a bit at these releases.
• In the US, only data of secondary importance are coming out. The NFIB small business optimism for July is expected to have increased a bit. While this indicator is not particularly market-affecting, it’s well worth watching because of the Fed’s emphasis on employment. Small businesses employ the majority of people in the US. We also get the preliminary unit labor costs and nonfarm productivity indices. This concept tracks the growth in employee compensation relative to real output in the nonfarm business sector. Taking into account that the employment cost index for Q2 rose by the least in the history of the report, the likelihood for another disappointment is high, in our view. Something like that could hurt the dollar a bit. Wholesale inventories for June are also coming out.
• From Canada, we get housing starts for July.
The Market
EUR/USD hits resistance at 1.1040 and retreats
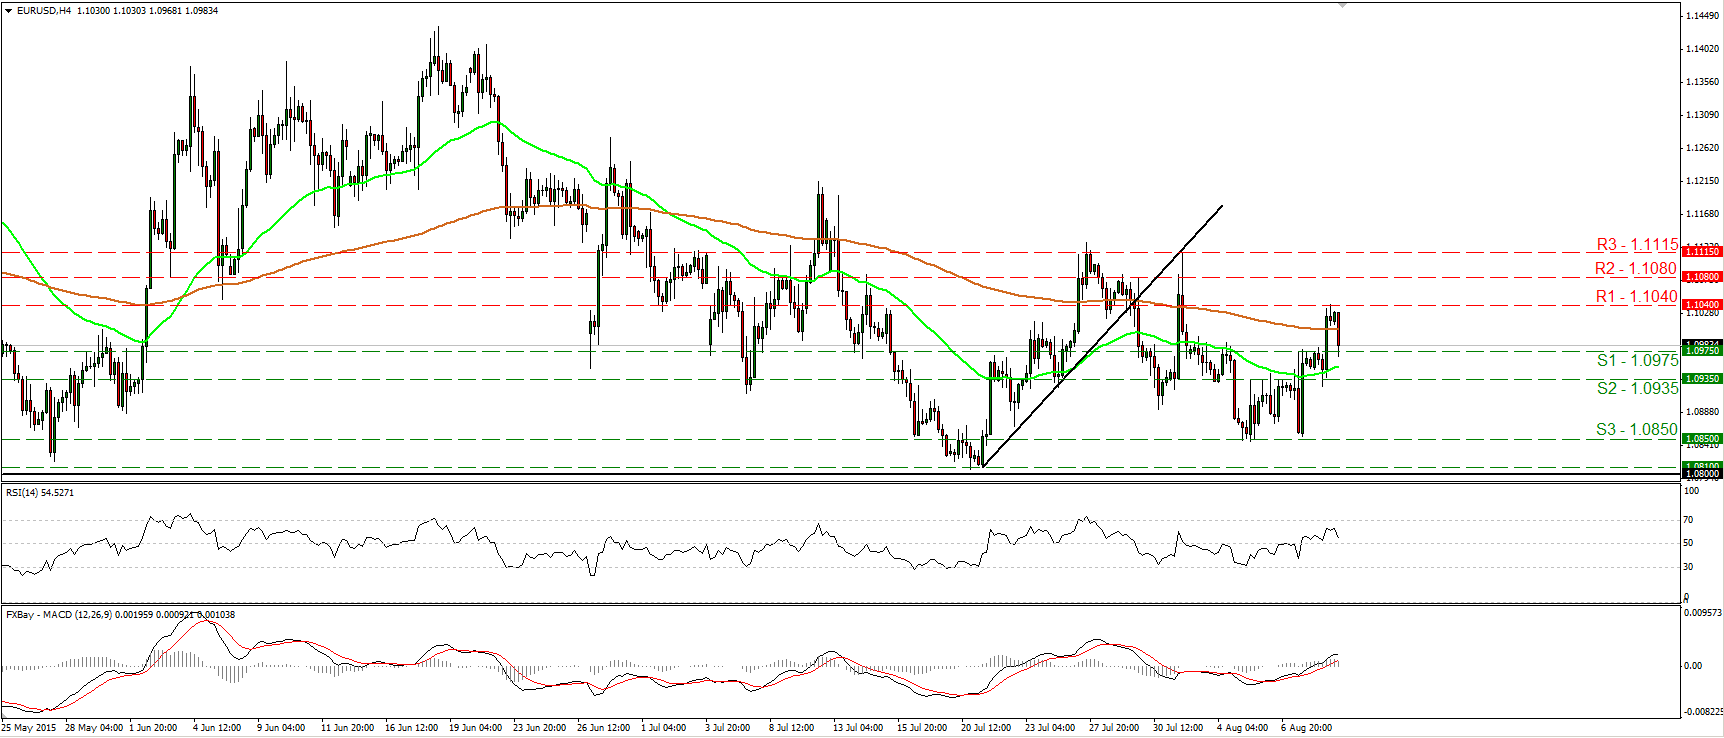
• EUR/USD raced higher on Monday, but hit resistance at 1.1040 (R1) and subsequently retreated to challenge the 1.0975 (S1) support barrier. I believe that the short-term outlook remains positive and that a move above the 1.1040 (R1) hurdle is likely to open the way for the next resistance at 1.1080 (R2). However, looking at our short-term momentum indicators, I see signs that the retreat may continue for a while before the bulls pull the trigger again. The RSI has turned down, while the MACD, although positive, shows signs of topping and could fall below its trigger line soon. A break below 1.0975 (S1) is likely to confirm the case of further pullback and perhaps challenge the 1.0935 (S2) support level. As for the broader trend, as long as EUR/USD is trading between 1.0800 and 1.1500, I would consider the longer-term picture as staying flat. I believe that a move above the psychological zone of 1.1500 is the move that could carry larger bullish implications, while a break below 1.0800 (S3) is needed to confirm a forthcoming lower low on the daily chart and perhaps turn the overall bias back to the downside.
• Support: 1.0975 (S1), 1.0935 (S2), 1.0850 (S3)
• Resistance: 1.1040 (R1), 1.1080 (R2), 1.1125 (R3)
GBP/JPY surges and hits resistance at 194.50
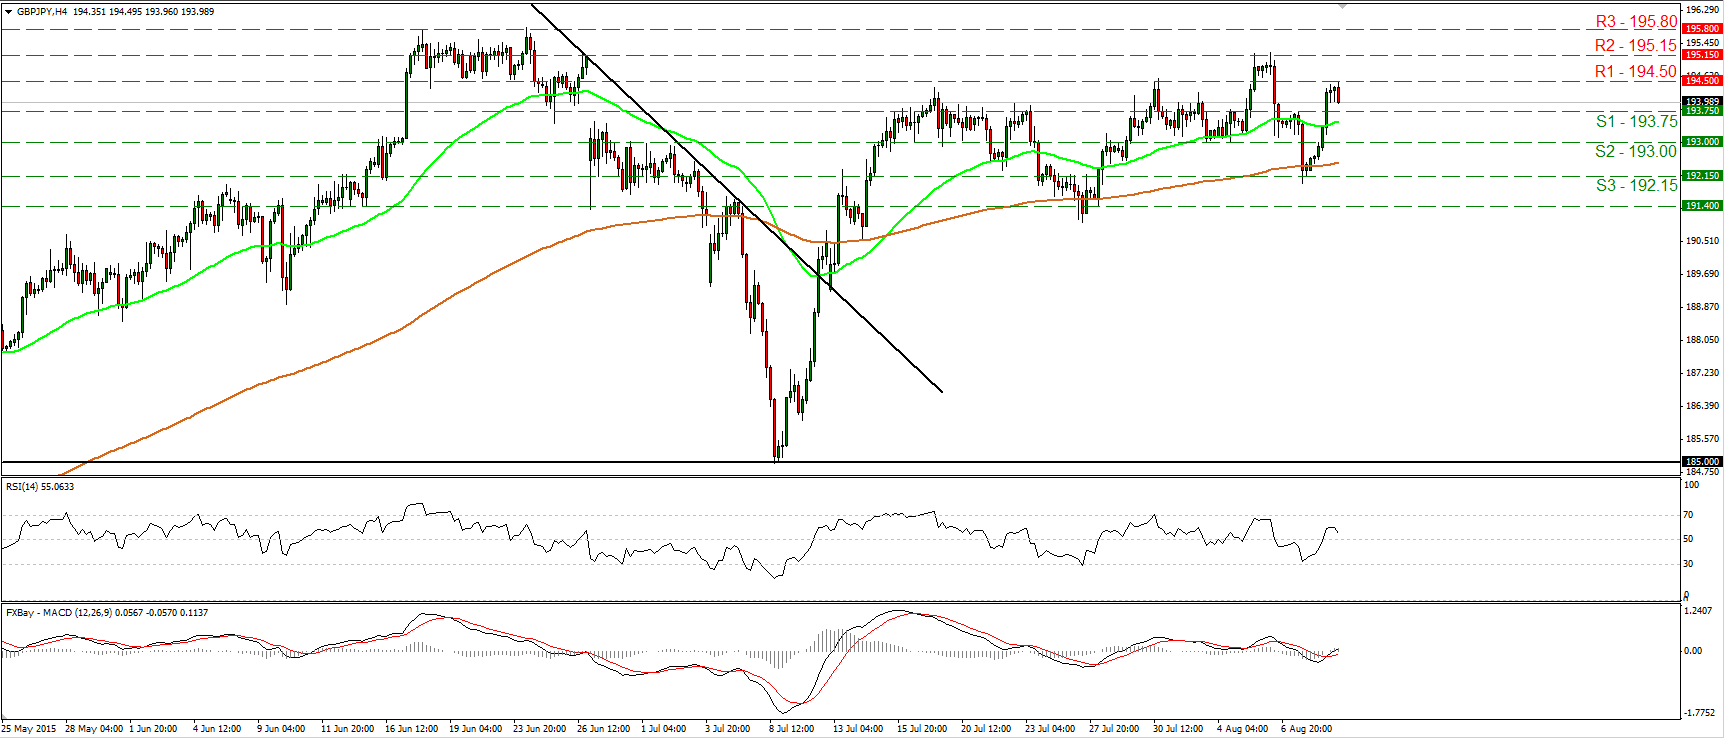
• GBP/JPY shot up after it found support near 192.15 (S1). However, the rally was stopped at 194.50 (R1) and then the rate retreated somewhat. The possibility for a lower high near 194.50 (R1) is high, and therefore, I see the likelihood that the forthcoming wave could be negative. A break below the 193.75 (S1) support barrier is possible to confirm the case and perhaps pave the way for a test at the 193.00 (S2) zone. Our short-term oscillators corroborate that view somewhat. The RSI, although above its 50 line, has turned down and could fall below 50 again. The MACD stands above its trigger line, slightly above zero, but shows signs of topping and that it could turn negative again. On the daily chart, I see that on the 8th of July, the rate rebounded from the 185.00 psychological zone, which stands pretty close to the 50% retracement level of the 14th of April – 24th of June rally. As a result, I would consider the overall path of this pair to be to the upside. I could consider any near-term declines as retracements of that longer-term uptrend.
• Support: 193.75 (S1), 193.00 (S2), 192.15 (S3)
• Resistance: 194.50 (R1), 195.15 (R2), 195.80 (R3)
AUD/USD collapses after hitting resistance at 0.7435
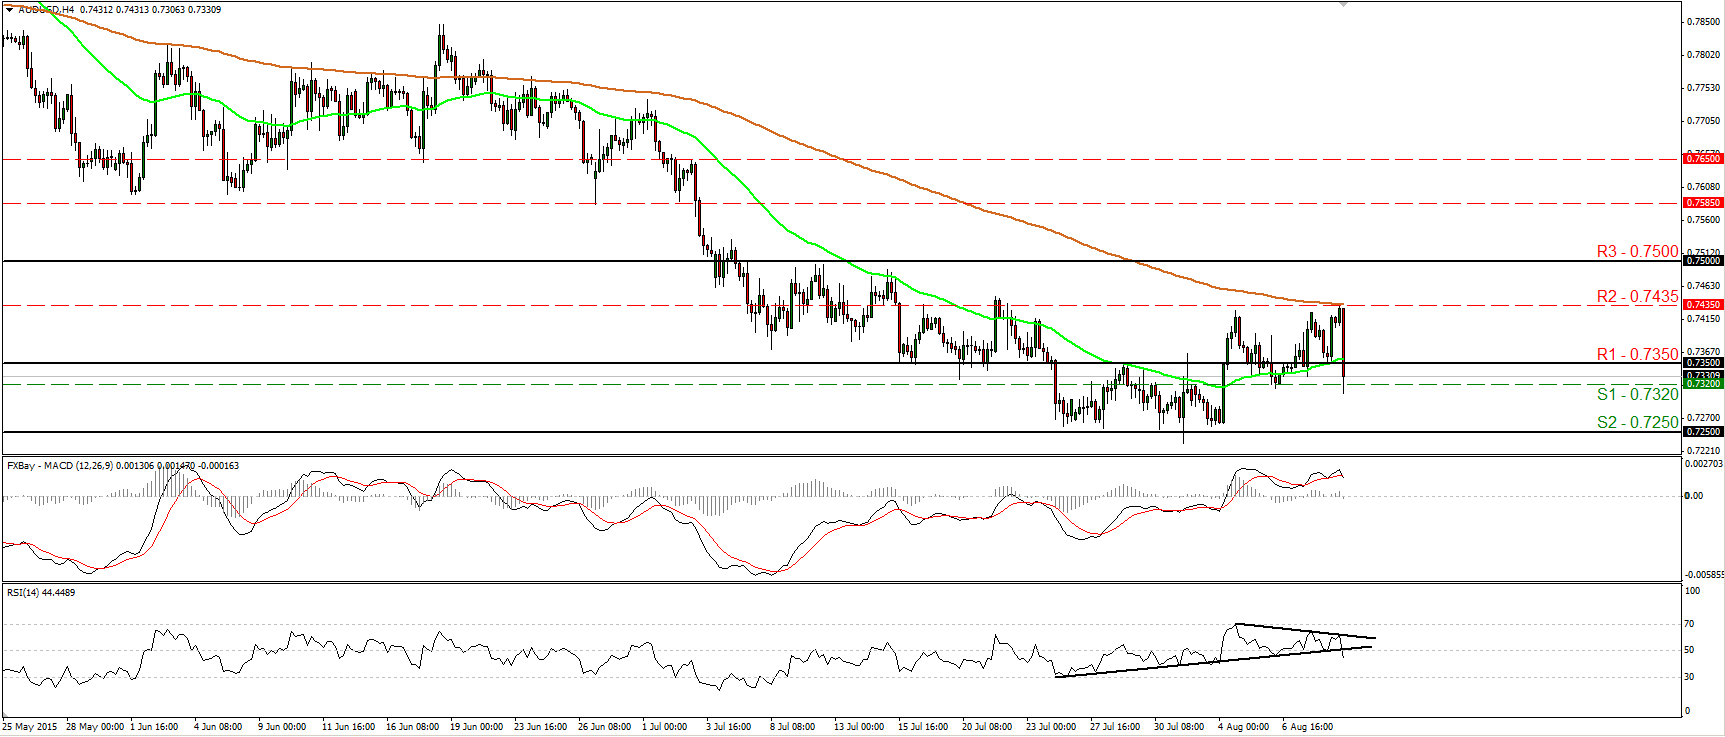
• AUD/USD plunged during the early European morning Tuesday after the PBoC devalued the CNY reference rate. The pair fell back below the 0.7350 barrier and hit support slightly below 0.7320 (S1). I believe that the negative wave is likely to continue. A break below 0.7320 (S1) could set the stage for extensions towards the well-tested zone of 0.7250 (S2). Our momentum studies support the notion and corroborate my view. The RSI fell below its upside support line and below its 50 level, while the MACD has topped and fallen below its trigger line. What is more, there is negative divergence between the RSI and the price action. On the daily chart, the completion of a head and shoulders formation and the move below the psychological zone of 0.7500 (R3) signaled the continuation of the prevailing long-term downtrend, in my opinion. I would expect a clear move below 0.7250 (S3) in the future to open the way for the psychological zone of 0.7000.
• Support: 0.7320 (S1), 0.7250 (S2), 0.7000 (S3)
• Resistance: 0.7350 (R1), 0.7435 (R2), 0.7500 (R3)
Gold reaches the 1105 obstacle
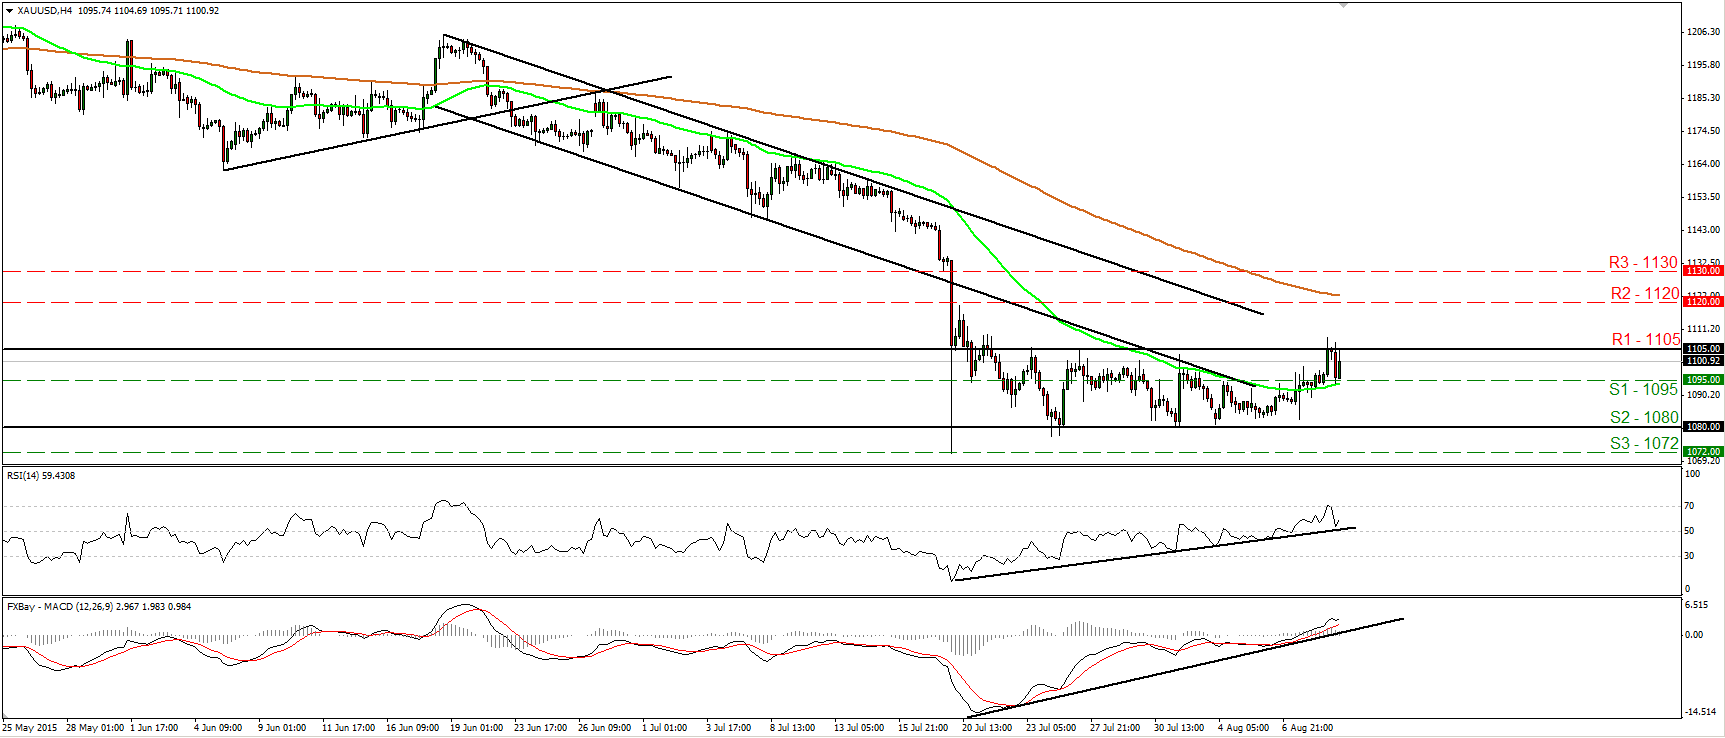
• Gold traded higher on Monday, hit resistance slightly above the 1105 (R1) zone, and then retreated to hit the 1095 (S1) support line. The metal is still trading between the support of 1080 (S2) and the resistance of 1105 (R2). Therefore, I view the short-term picture as remaining neutral. However, our short-term oscillators reveal positive momentum and still support the idea that the metal could trade higher for a while. The RSI rebounded from slightly above its upside support line, while the MACD stands above both its zero and signal lines, pointing somewhat up. A break above 1105 (R1) could turn the near-term picture slightly positive and could open the way for the 1120 (R2) barrier. In the bigger picture, the plunge on the 20th of July triggered the continuation of the longer-term downtrend and this keeps the overall bias of the yellow metal to the downside, in my view. As a result, I would treat any further positive near-term waves as corrective moves.
• Support: 1095 (S1), 1080 (S2), 1072 (S3)
• Resistance: 1105 (R1), 1120 (R2), 1130 (R3)
DAX futures rebound from near 11470
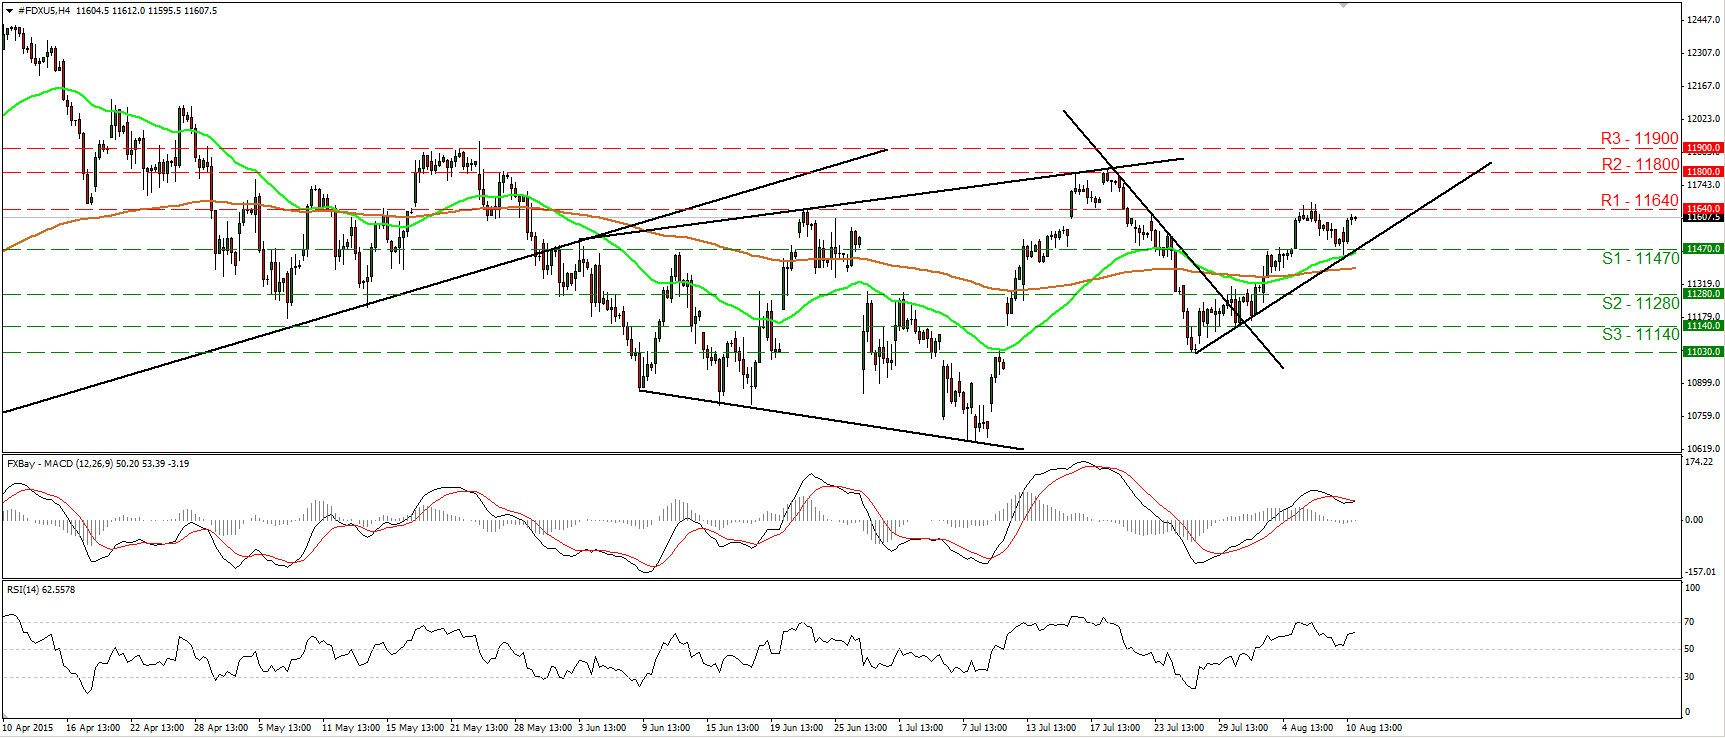
• DAX futures traded higher after hitting support fractionally below the 11470 (S1) support barrier, near the uptrend line taken from the low of the 27th of July. Since the index is printing higher peaks and higher troughs above that short-term trend line, I would consider the near-term bias to stay positive. As a result, I would expect a clear move above 11640 (R1) to open the way for the next resistance at 11800 (R2). The RSI hit support slightly above its 50 line and edged higher, while the MACD, already positive, has bottomed and could move above its trigger line soon. These indicators detect positive momentum and amplify the case for further advances. As for the broader trend, given the 20th -27th July plunge, I would hold my flat stance. I would like to see a clear close above 11800 (R2) before I get confident on the continuation of the major upside path.
• Support: 11470 (S1), 11280 (S2), 11140 (S3)
• Resistance: 11640 (R1) 11800 (R2), 11900 (R3)

