Draghi fails to offer comfort
After the recent bout of volatility in the bond market recent, investors were waiting to hear some comforting words from ECB President Draghi yesterday. However all he said was “get used to it.” He made the point that with interest rates at such low levels, bond prices are bound to be more volatile and “we should get used to periods of higher volatility” (this is just a function of bond mathematics). While this is true, it isn’t what people wanted to hear. They were hoping that he would say that the ECB would use its QE program to buy bonds when necessary to dampen the volatility, along the lines of what ECB Gov. Benoit Coeure had said recently. But on the contrary, he said that ” in terms of the impact that this might have on our monetary policy stance, the Governing Council was unanimous in its assessment that we should look through these developments and maintain a steady monetary policy stance.” As a result, German bond yields leapt higher once again, with 10-year yields up 17 bps. They’ve risen from 0.49% last Friday to 0.88% at yesterday’s close, i.e. almost doubling in less than a week. There is no longer any fear that the ECB might not be able to find enough bonds to buy at yields over the deposit rate of -0.2%.
Bunds drag up other bonds
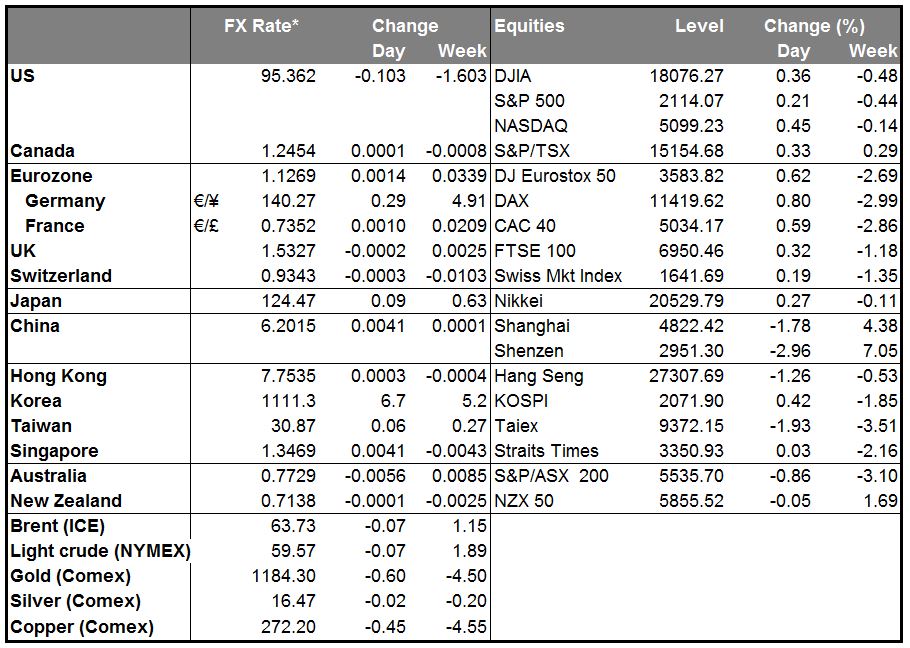
The surge in Bund yields dragged bond yields higher across the board. French 10-year yields were up 15 bps, while peripheral bond yields rose less – only 3 to 5 bps. But US Treasuries were dragged up 10 bps and even Japanese yields rose 5 bps. The correlation among global bond markets is quite striking. Nonetheless Bund yields did rise more than other markets and that helped to support the euro against most other currencies.
Attention to return to Greece
Now that the ECB meeting is out of the way, attention may return to Greece. They seem to be making some progress but there remain unbridgeable gulfs. Apparently the creditors have moved closer to the Greek position on the primary budget surplus, but Greece has refused to concede any ground on several points, such as pensions, and those sticking points remain. Greek PM Tsipras said “don’t worry” about Friday’s EUR 300mn payment to the IMF, but that may be because he is planning on wrapping all the June payments into one to be made at the end of the month. That’s the one we should worry about.
The problem is that even if Tsipras signs an agreement soon, it would need to be approved by the Greek parliament, and that would require one of three things:
1. Passage through parliament, probably with support from the opposition parties or a change in the government coalition;
2. A referendum, followed by a vote in parliament (although that would probably take more than two weeks; or
3. An early election, followed by a vote. But time is running out!
I can’t say how the Greek situation will affect EUR today. I trust that Tsipras realizes how disastrous the failure to agree would be and so I expect him to cave in eventually, but no money will be disbursed until the Greek political process has run its course, and in this case you cannot trust the wisdom of crowds to do the right thing. It’s still possible that the result no one wants is what we get.
Dollar generally higher as US data support
Nonetheless, the dollar was generally higher except against EUR and SEK (which even outperformed EUR). The ADP employment report hit estimates of 200k, a healthy number, while the April trade deficit was narrower than expected as imports fell – that will boost net exports in the Q2 GDP figures. The market ignored a larger-than-expected drop in the Market service-sector PMI and Fed funds rate expectations rose sharply (up 8 bps at end-2017). Commodity currencies, including CAD, were weak as oil prices plunged. The symposium between OPEC members and oil industry specialists got under way and all the indications were that the organization would not reduce production at tomorrow’s meeting. On the contrary, Iraq said it will increase its exports this month and Iran is discussing how it’s going to increase its output once sanctions are removed. I would expect to get more such news today from the symposium and for the commodity currencies to remain under pressure.
Australia’s trade deficit widens sharply
AUD was the weakest of the G10 currencies over the last 24 hours as the country’s trade deficit widened sharply and retail sales were unchanged in April, both below estimates. This disappointing news suggests that the economy will not get a boost from either foreign nor domestic demand. I remain bearish on AUD as China continues to restructure its economy, which is bound to involve less demand for Australia’s industrial commodities.
Today’s highlights:
During the European day, the Bank of England holds its policy meeting. There’s little chance of a change in policy, hence the impact on the market could be minimal, as usual. The minutes of the meeting however should make interesting reading when they are released on 17th of June.
From Canada, we get the Ivey PMI for May. Following the rise in the RBC manufacturing PMI on Monday, we could see a positive surprise in the Ivey figure as well. Nevertheless, the decline in oil prices ahead of the OPEC meeting on Friday, are likely to keep CAD under increased selling pressure.
In the US, we get the initial jobless claims for the week ended May 30.
We have several speakers on Thursday’s agenda: ECB Executive Board member Yves Mersch, Governing council member Erkki Liikanen, ECB Governing council member Klaas Knot, Riksbank Governor Stefan Ingves and Fed Governor Daniel Tarullo.
The Market
EUR/USD higher after finding support near the 1.1065 level
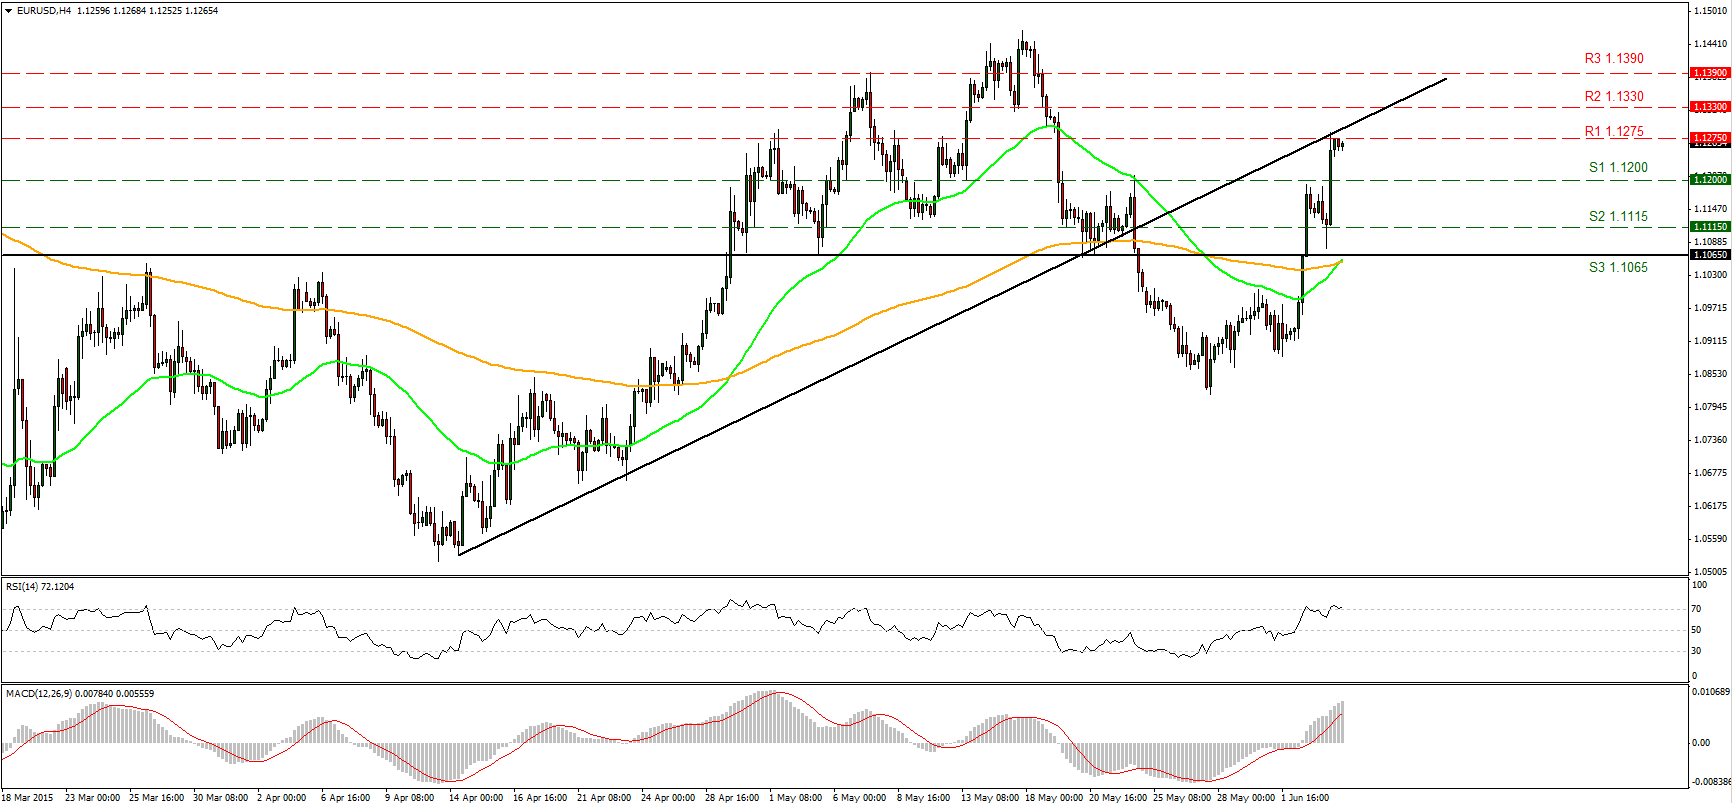
EUR/USD declined a bit on Wednesday after ECB President Draghi admitted a slight loss of momentum in the recovery, but following a comment over the improvement in the perspectives of growth and higher inflation expectations, Bund yields surged and dragged EUR with them. The move was halted slightly above our prior 1.1265 resistance line but as I was not convinced of a clear break, I moved the level to 1.1275 (R1). I would expect a clear break of 1.1275 (R1) to trigger extensions towards our next resistance of 1.1330 (R2). The RSI found support at its 70 line and points up, while the MACD lies above its zero and trigger lines, meaning that both these short-term momentum indicators are in overbought territory. This suggests accelerating bullish momentum, but also that a minor pullback is possible before the next leg high.
• Support: 1.1200 (S1), 1.1115 (S2), 1.1065 (S3) .
• Resistance: 1.1275 (R1), 1.1330 (R2), 1.1390 (R3).
GBP/USD in a sideways mode
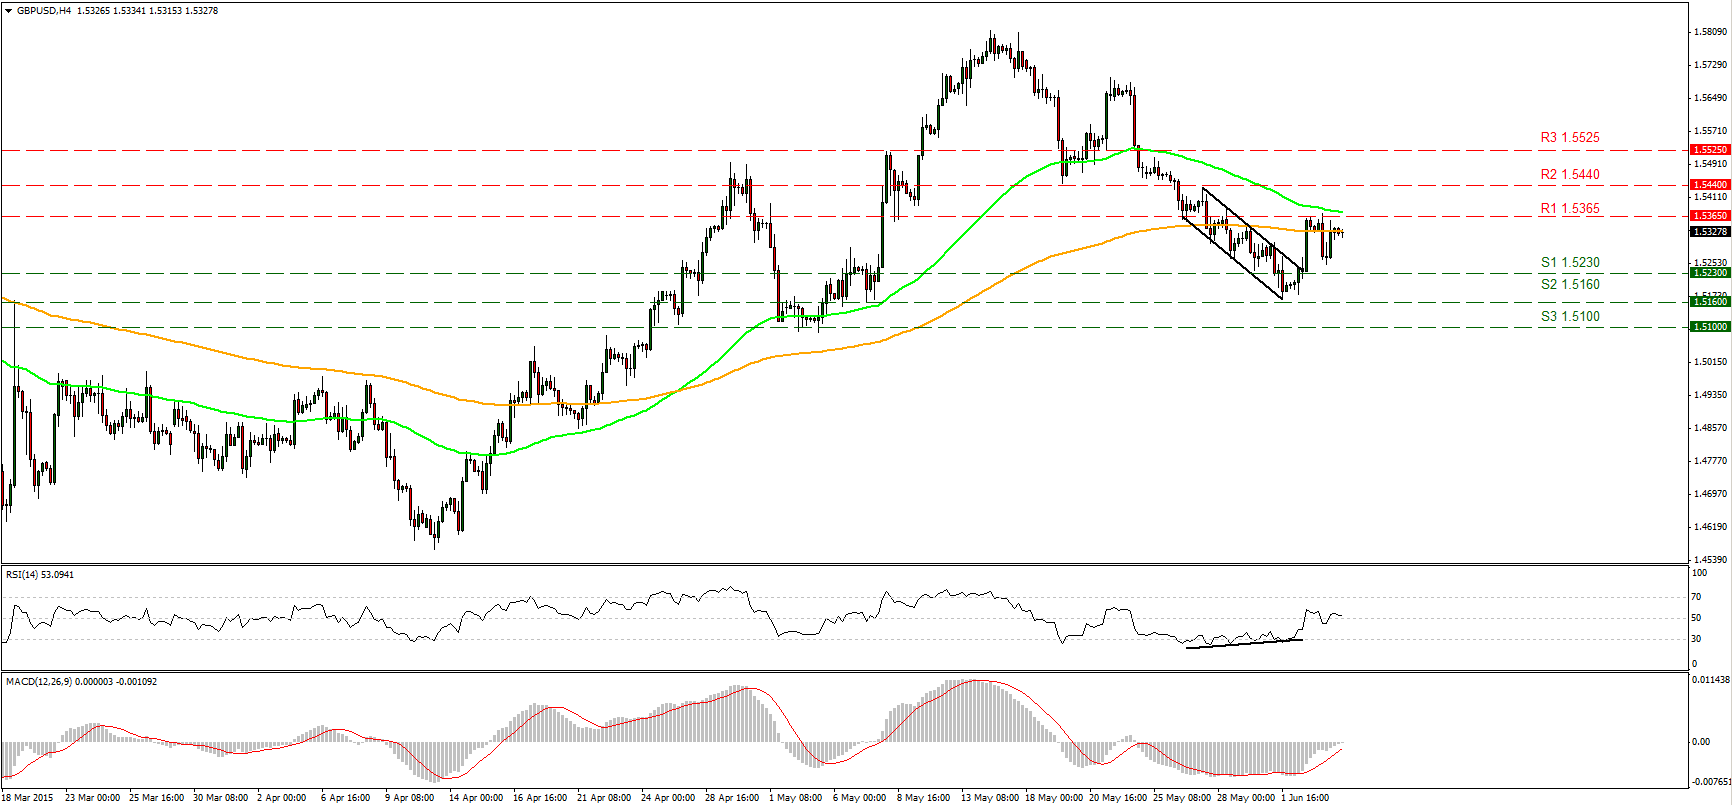
GBP/USD declined on Wednesday after several unsuccessful attempts to break the 1.5365 (R1) resistance hurdle, but found renewed buy orders few pips above our 1.5230 (S1) support line. During the European morning Thursday the pair trades just below the 200-period moving average and a fall below it would add to the negative short-term picture. Our near-term momentum indicators support this notion as the RSI seems ready to cross below its 50 line, while the MACD has topped around its zero line and could turn down again. On the daily chart, the rate remained above the 80-day exponential moving average, which keeps broader picture cautiously positive.
• Support: 1.5230 (S1) 1.5160 (S2), 1.5100 (S3) .
• Resistance: 1.5365 (R1), 1.5440 (R2), 1.5525 (R3).
USD/JPY consolidates within a range
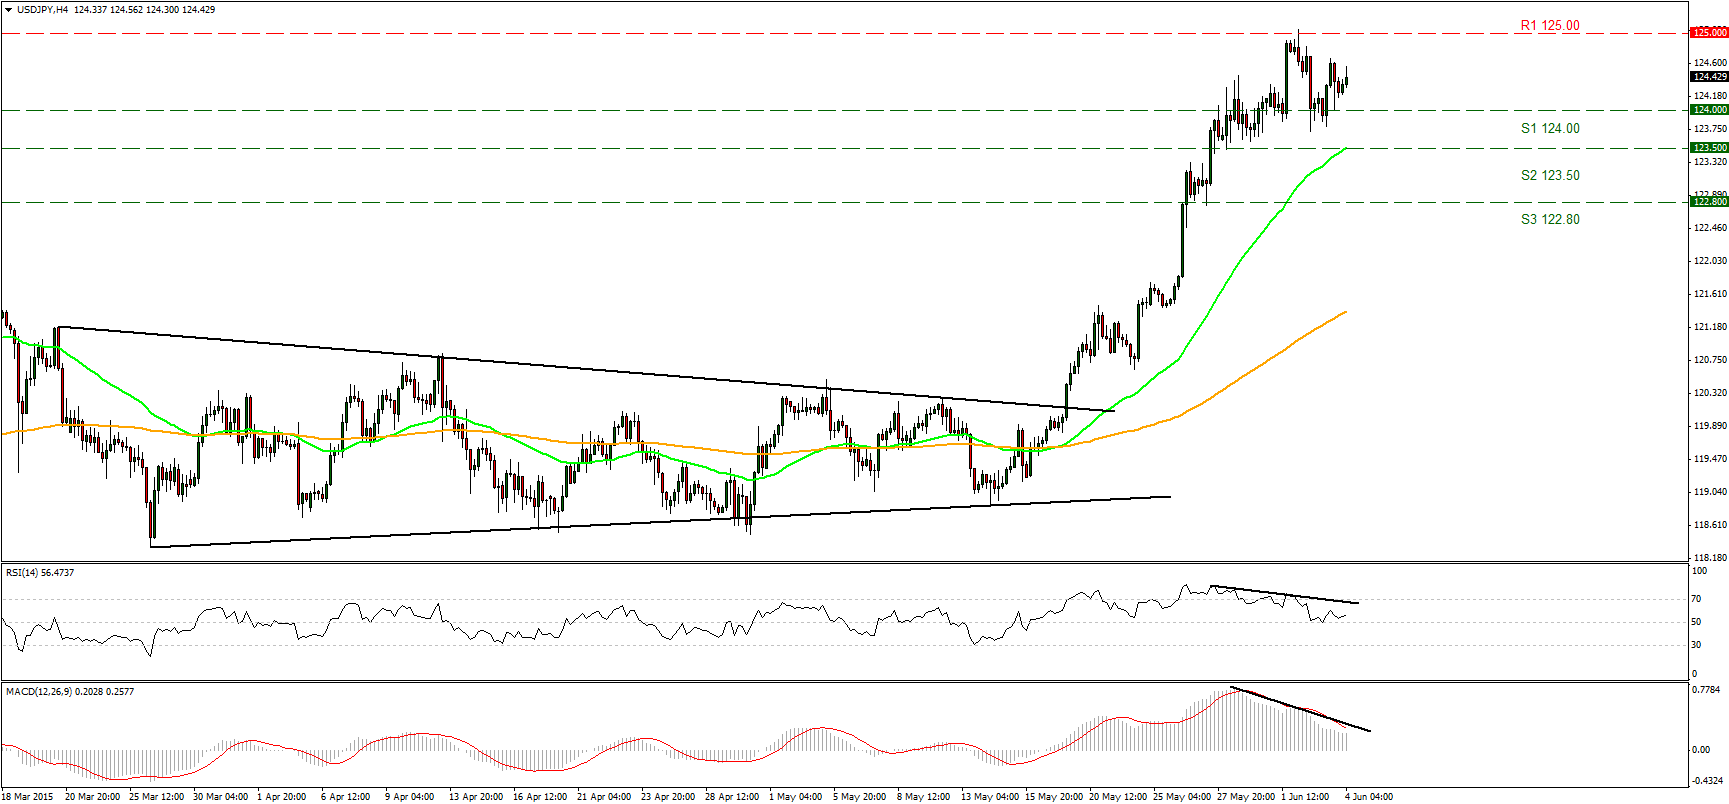
USD/JPY remained locked in a consolidation mode, within a range of 124.00 (S1) and 125.00 (R1). I will hold the view that the price is moving within a sideways path and a break in either direction is needed to determine the forthcoming near-term bias. The negative divergence seen in our short-term momentum indicators supports the scenario that the next move is more likely to be downwards. Nevertheless, I would treat any declines as a corrective phase of the larger uptrend that could provide renewed buying opportunities. On the daily chart, the pair lies above both its 50- and 200-day moving averages that keep the longer-term bullish trend intact.
• Support: 124.00 (S1), 123.50 (S2), 122.80 (S3).
• Resistance: 125.00 (R1), 125.80 (R2), 126.60 (R3).
DAX futures stays above the long-term uptrend line
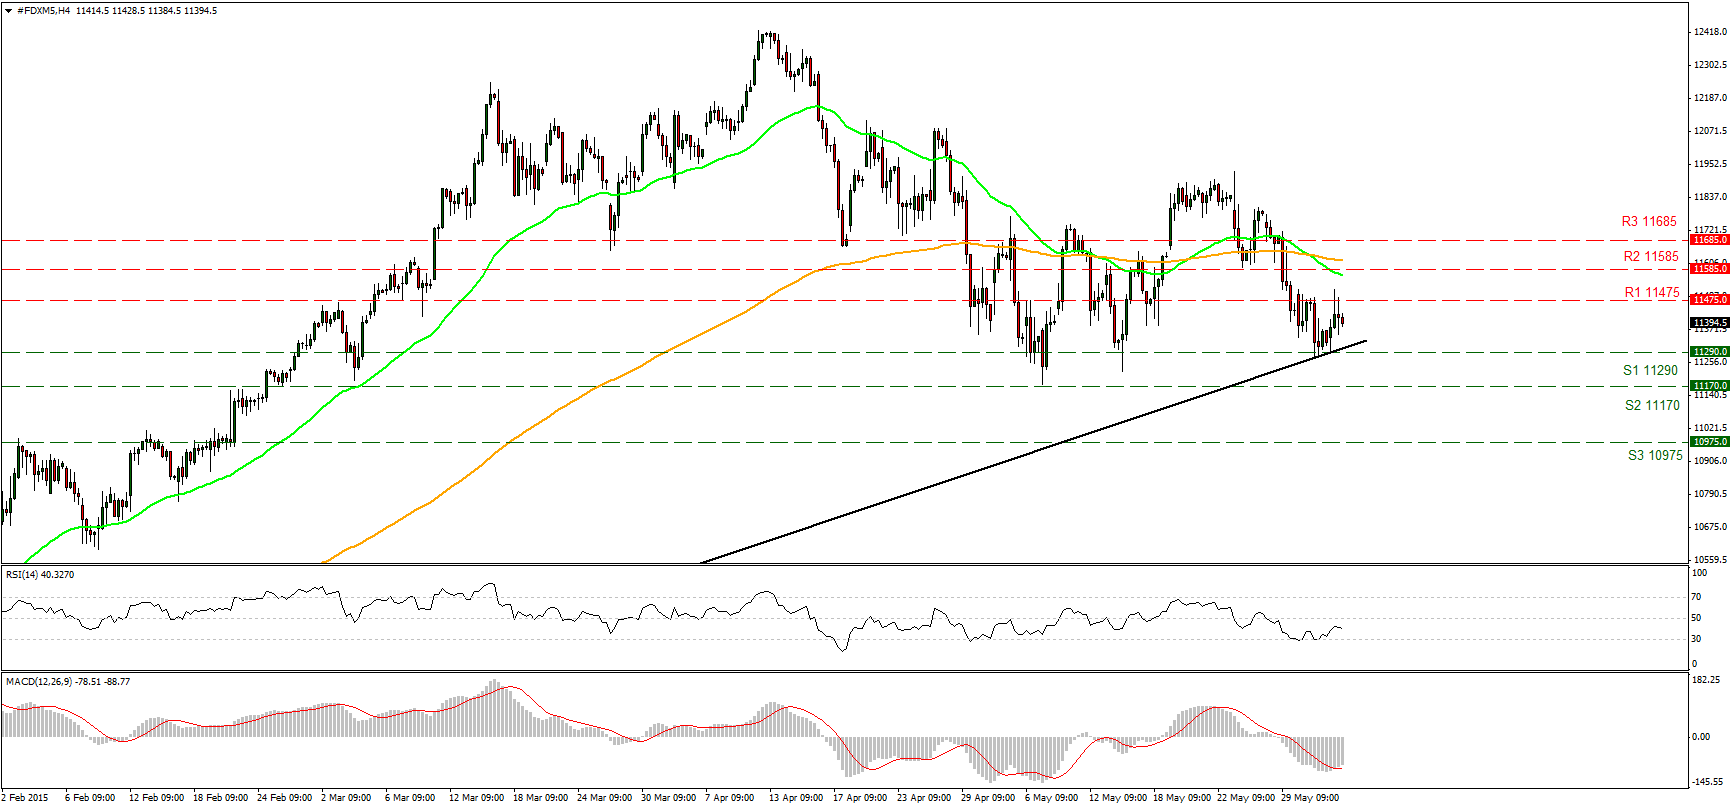
DAX futures rose on Wednesday after finding support at the crossroad of the 11290 (S1) area and the long-term uptrend line taken from back at the low of the 16th of October. I would now expect the bulls to boost the index higher towards the 11475 (R1) resistance line, and a break of that zone could trigger further advances perhaps towards our next resistance of 11585 (R2). The near-term momentum indicators favour this notion, as the RSI rebounded from its 30 line and heads higher, while the MACD, although negative, has bottomed and crossed above its signal line. On the daily chart, the fact that the index is still above the long-term black line indicates that the upside path remains intact, in my view. Only if the index falls below that line would the medium-term picture switch to the downside.
• Support: 11290 (S1), 11170 (S2), 10975 (S3).
• Resistance: 11475 (R1), 11585 (R2), 11685 (R3) .
WTI gyrates around 60
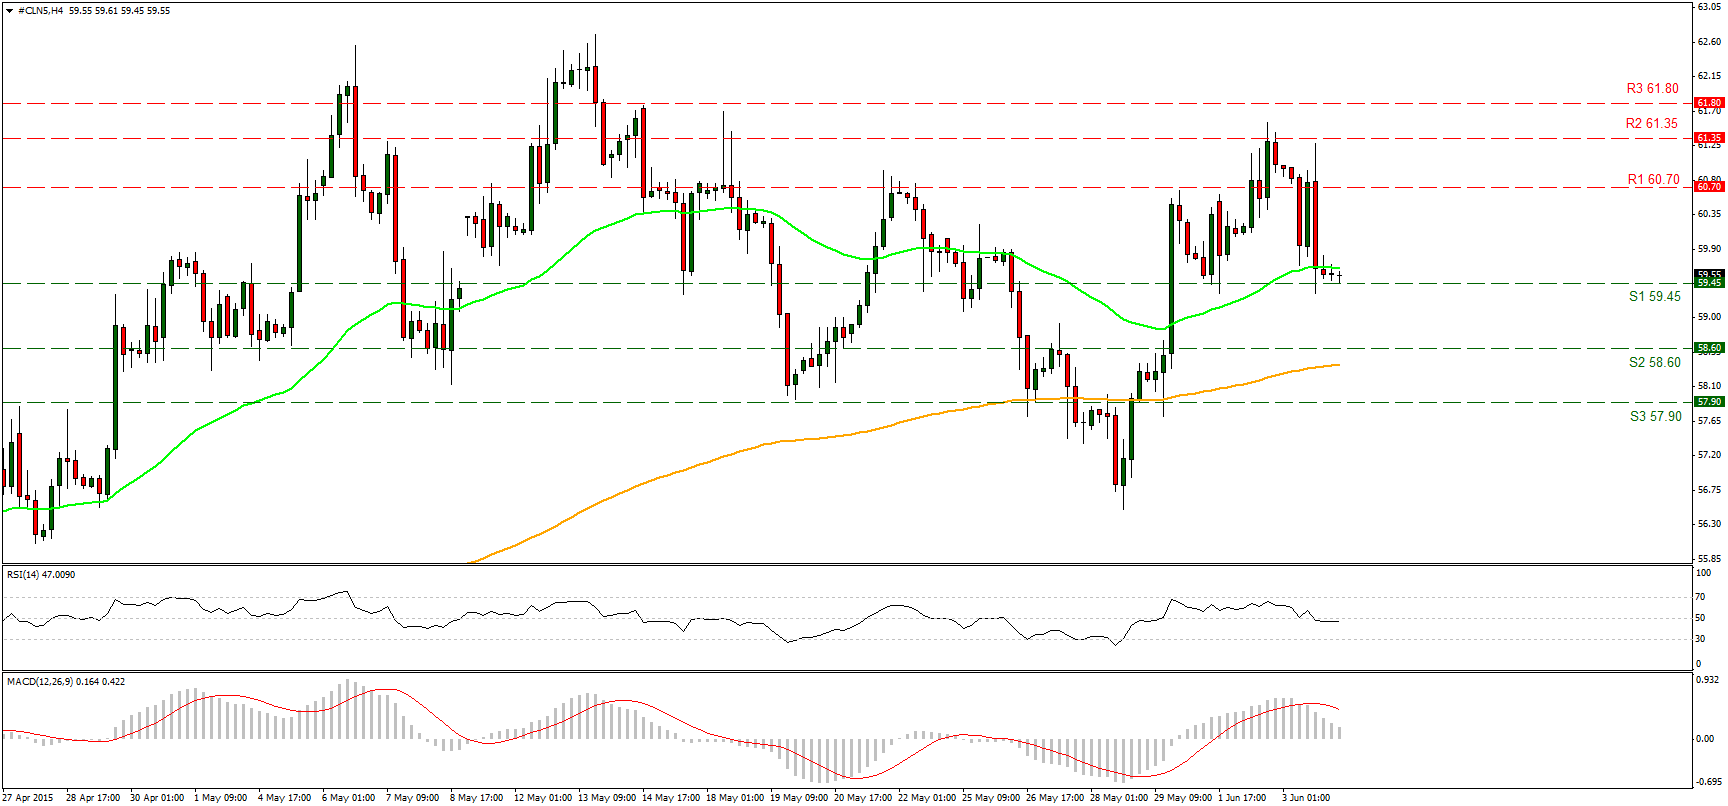
WTI broke below our support-turned into-resistance level of 60.70 (R1) but the move was halted near our support zone of 59.45 (S1). Investors’ restrained mood ahead of the OPEC meeting on Friday is reflected in the price action, as there is no clear trending direction. WTI gyrates around 60 and is not giving any clear directional impulses, which can be also observed in the short- and medium-term momentum indicators. The near-term RSI moves along its 50 level, while the MACD, although slightly below its trigger line, stands just above its zero line and points sideways. A similar picture is seen on our daily momentums. Therefore, I would like to adopt a neutral bias at least for now, until we have a better technical picture.
• Support: 59.45 (S1), 58.60 (S2), 57.90 (S3).
• Resistance: 60.70 (R1), 61.35 (R2), 61.80 (R3) .

