Iron Mountain Incorporated (IRM) is engaged in storing records, primarily paper documents and data backup media, and provide information management services. The Company offers records management services, data protection and recovery services and information destruction services.
I found this stock using a real-time custom scan. This one hunts for vol gainers on the day. But this is also an order flow note -- check out the volume in the Jun 37.5 calls -- those are opening purchase orders .
Custom Scan Details
Stock Price GTE $5
IV30™ GTE 30
IV30™ Percent Change GTE 10
Average Option Volume GTE 1,200
IV30™ Change GTE 7
The goal with this scan is to identify names with rising IV30™ that also have a reasonable amount of liquidity in the options (thus the minimum average option volume) and enough strikes to spread and thus a minimum stock price. I also require a minimum vol level in order to avoid any boring ETFs (or whatever).
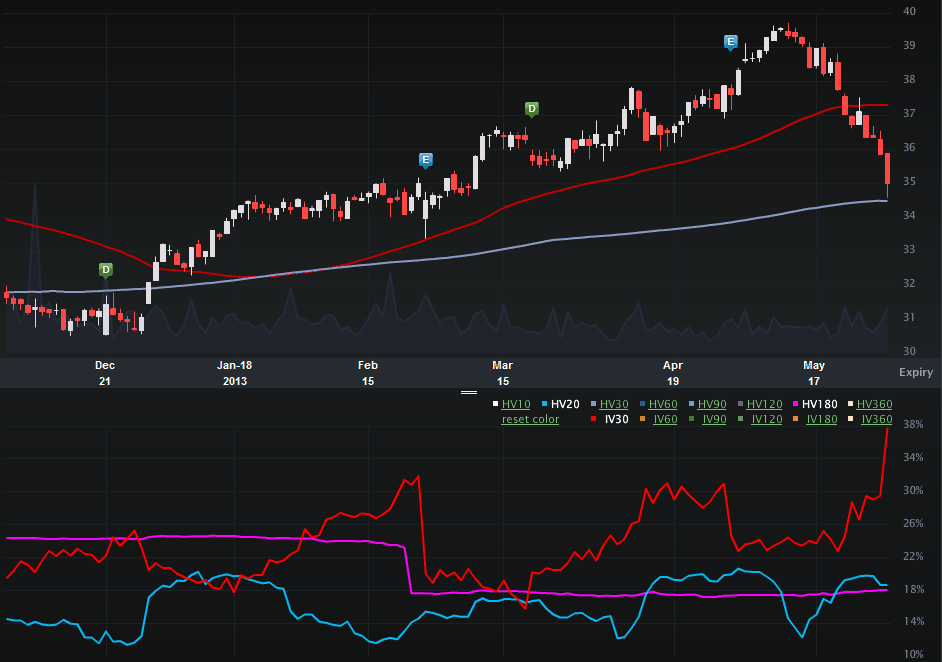
The six-month IRM Charts Tab is included (below). The top portion is the stock price the bottom is the vol (IV30™ - red vs HV20™ - blue vs HV180™ - pink).
On the stock side we can see how IRM hit a recent high of $39.71 in early May, which is in fact a multi-year high. But then…the stock started falling. In the last two weeks (ish) the stock is down 12% and the vol has decided it’s time to explode.
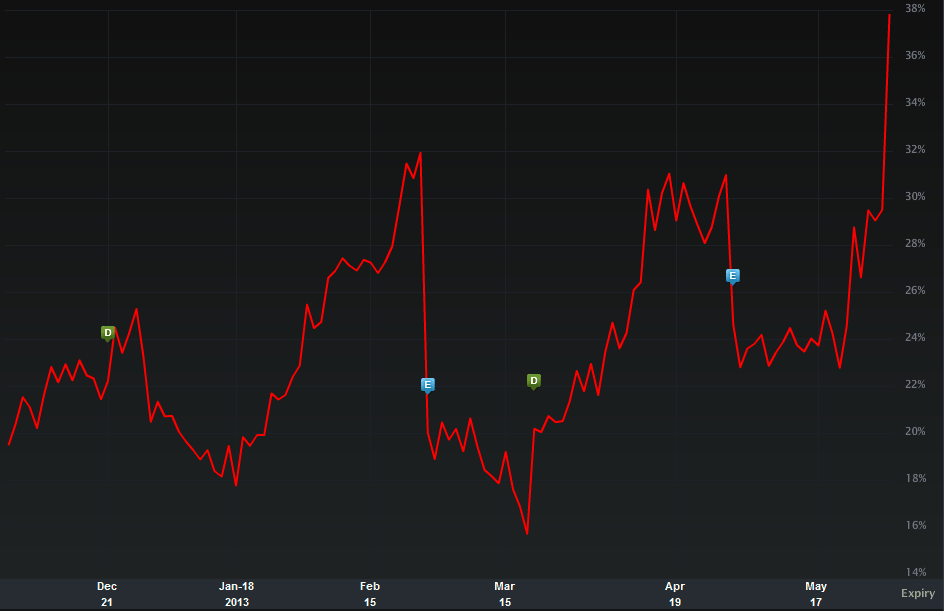
I have included a six-month IV30™ chart in isolation, below for a more myopic view of the vol.
Check out that explosion in the implied. On 5-22-2013 the IV30™ was 22.77%. Today we’re looking at an IV30™ of over 37%, or a 60%+ rise in just about ten days. That’s certainly an abrupt and noteworthy move especially considering that earnings were released on 5-1-2013, so this vol rise and stock drop are not associated with that news event.
IRM does have a history of huge vol and stock moves – they’re just hidden in a short-term six-month chart. The 52 wk low in stock price is $23.40 and the 52 wk range in IV30™ is [15.84%, 72.46%]. Look at that high number of 70%+ implied. In English, IRM has seen substantially higher vol (risk) so this pattern of late may have legs.
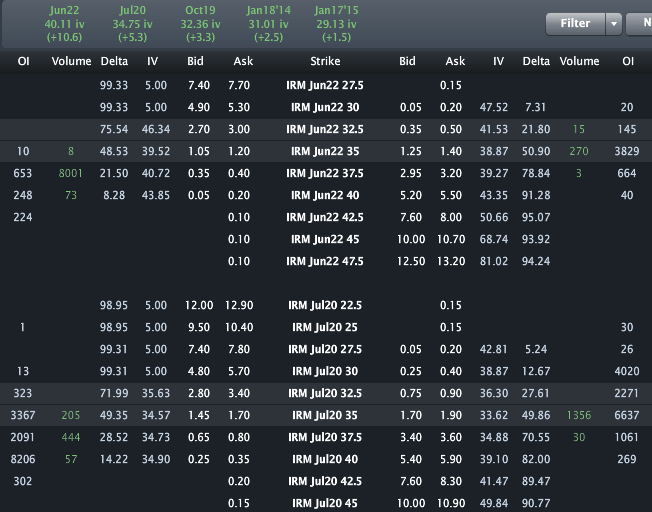
Finally, let's look to the Options Tab (below).
Across the top we can see the monthly vols are priced to 40.11% in Jun and 34.75% in Jul. Again, if this stock drop and vol rise continues, it’s not impossible to see a doubling of vol in a relatively short amount of time based on the history of this stock over the last year.
Also, as i mentioned up font, check out the volume in the Jun 37.5 calls (the green number to the left of that strike). IRM averages 2,558 calls traded per day in total and has seen over 8,000 Jun 37.5 calls alone traded already.
This one goes on the watchlist…
Disclosure: This is trade analysis, not a recommendation.
Images provided by Livevol®
- English (UK)
- English (India)
- English (Canada)
- English (Australia)
- English (South Africa)
- English (Philippines)
- English (Nigeria)
- Deutsch
- Español (España)
- Español (México)
- Français
- Italiano
- Nederlands
- Português (Portugal)
- Polski
- Português (Brasil)
- Русский
- Türkçe
- العربية
- Ελληνικά
- Svenska
- Suomi
- עברית
- 日本語
- 한국어
- 简体中文
- 繁體中文
- Bahasa Indonesia
- Bahasa Melayu
- ไทย
- Tiếng Việt
- हिंदी
Iron Mountain: Stock Turns Down. Will History Repeat Itself?
Published 06/04/2013, 03:58 AM
Updated 07/09/2023, 06:31 AM
Iron Mountain: Stock Turns Down. Will History Repeat Itself?
3rd party Ad. Not an offer or recommendation by Investing.com. See disclosure here or
remove ads
.
Latest comments
Install Our App
Risk Disclosure: Trading in financial instruments and/or cryptocurrencies involves high risks including the risk of losing some, or all, of your investment amount, and may not be suitable for all investors. Prices of cryptocurrencies are extremely volatile and may be affected by external factors such as financial, regulatory or political events. Trading on margin increases the financial risks.
Before deciding to trade in financial instrument or cryptocurrencies you should be fully informed of the risks and costs associated with trading the financial markets, carefully consider your investment objectives, level of experience, and risk appetite, and seek professional advice where needed.
Fusion Media would like to remind you that the data contained in this website is not necessarily real-time nor accurate. The data and prices on the website are not necessarily provided by any market or exchange, but may be provided by market makers, and so prices may not be accurate and may differ from the actual price at any given market, meaning prices are indicative and not appropriate for trading purposes. Fusion Media and any provider of the data contained in this website will not accept liability for any loss or damage as a result of your trading, or your reliance on the information contained within this website.
It is prohibited to use, store, reproduce, display, modify, transmit or distribute the data contained in this website without the explicit prior written permission of Fusion Media and/or the data provider. All intellectual property rights are reserved by the providers and/or the exchange providing the data contained in this website.
Fusion Media may be compensated by the advertisers that appear on the website, based on your interaction with the advertisements or advertisers.
© 2007-2024 - Fusion Media Limited. All Rights Reserved.
