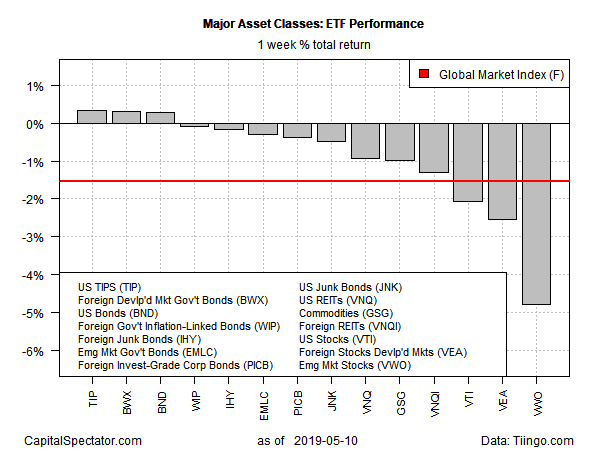
Risk-off sentiment triggered by rising US-China trade tensions unleashed red ink in financial markets far and wide last week. The only exceptions: high-grade government and corporate bonds, based on a set of exchange-trade funds representing the major asset classes.
Everything else slumped amid rising fears that the trade war between the US and China is escalating. The biggest loser: emerging market stocks. Vanguard FTSE Emerging Markets (VWO) tumbled 4.8% during the trading week ended May 10. The hefty decline marks the biggest weekly setback for the ETF in more than a year.
The safe havens of high-grade bonds in the developed world, by contrast, were buoyed last week. A trio of representative ETFs essentially shared first-place for last week’s performance profile: iShares TIPS (TIP), SPDR Bloomberg Barclays International Treasury Bond (BWX), and Vanguard Total US Bond Market (BND). Each fund posted a roughly 0.3% increase.
Not surprisingly, the Global Markets Index (GMI.F) took a hit last week. This investable, unmanaged benchmark that holds all the major asset classes (except cash) in market-value weights fell 1.5% — the deepest weekly decline for GMI.F since December.
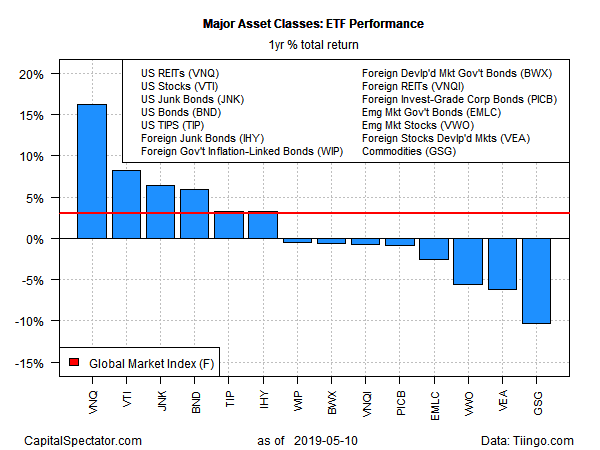
For the one-year trend, US real estate investment trusts (REITs) continue to lead the field. Although last week’s losses have trimmed the gain, Vanguard Real Estate (VNQ) remains comfortably on top of one-year performance rankings for the major asset classes with a 16.3% total return through Friday’s close.
At the opposite end of the performance ranking for the trailing one-year window: broadly defined commodities. The iShares S&P GSCI Commodity-Indexed Trust (GSG) has shed 10.3% over the past 12 months.
GMI.F’s one-year return at the end of last week’s trading is a moderate 3.0%.
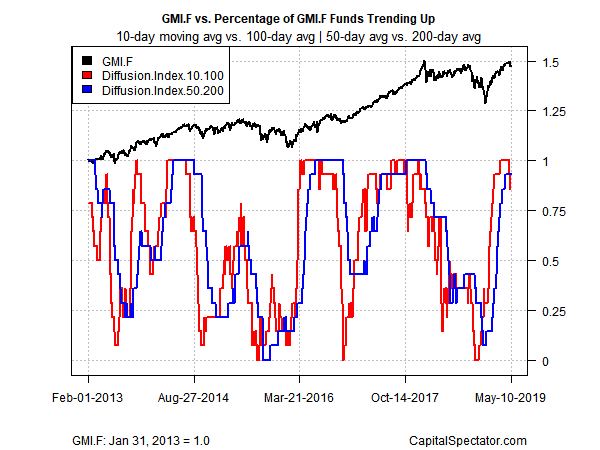
Last week’s broad-based selling cut into the upside momentum trend for markets, although most ETFs in the list above continue to post bullish profiles, based on two sets of moving averages. The first momentum measure compares the 10-day moving average with the 100-day average, a proxy for short-term trending behavior (red line in chart below). A second set of moving averages (50 and 200 days) offers an intermediate measure of the trend (blue line). The indexes range from 0 (all funds trending down) to 1.0 (all funds trending up). Based on data through last week’s close, bullish momentum continued to dominate, albeit less vs. recent history. Note, however, that the slide in the short-term indicator below the intermediate-term indicator suggests that momentum overall will continue to weaken.