In a post yesterday I somewhat rhetorically titled the post wondering if the equity market was at a top. In short, I do not know, but offered suggestions for investors about reviewing their asset allocation vis-à-vis their spending needs.
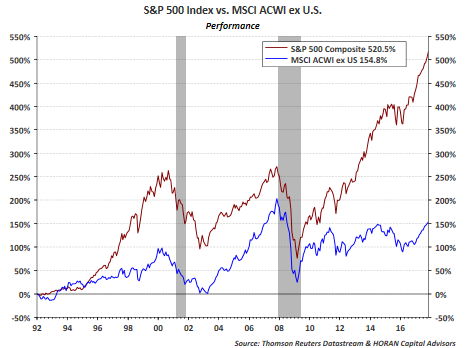
Not all markets have traveled the same path as the S&P 500 Index though. A number of markets outside the U.S have lagged the U.S. since the end of the financial crisis. The below chart compares the cumulative performance of the S&P 500 Index (SPY (NYSE:SPY)) versus the iShares MSCI ACWI ex US (NASDAQ:ACWX).The chart goes back to the beginning of 1992 and clearly the S&P 500 has a performance advantage with a widening gap beginning to develop around 2011.

Yesterday's post touched on the narrowing performance taking place with large/mega cap U.S. stocks contributing heavily to overall market returns. Some of these stocks are included in the basket know as the the FAANGs (Facebook (NASDAQ:FB), Apple (NASDAQ:AAPL), Amazon (NASDAQ:AMZN), Netflix (NASDAQ:NFLX) and Alphabet (NASDAQ:GOOGL) (f/k/a Google)) and other mega caps like Microsoft (NASDAQ:MSFT), Home Depot (NYSE:HD) and Boeing (NYSE:BA). The underperformance of the ACWX is largely a result of no allocation to the FAANGs and mega cap U.S stocks by the index's definition, i.e., ex U.S. From a sector weight standpoint, the ACWX is under weight technology, health care and consumer discretionary sectors by 12%, 5% and 2%, respectively.
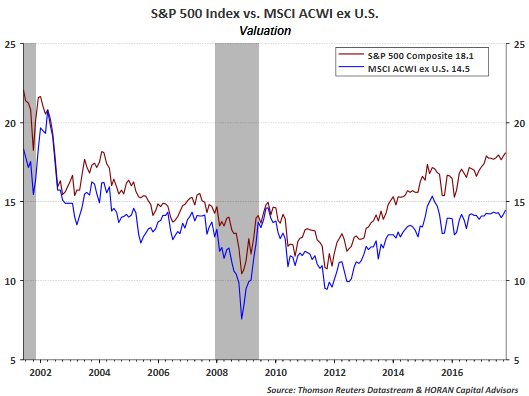
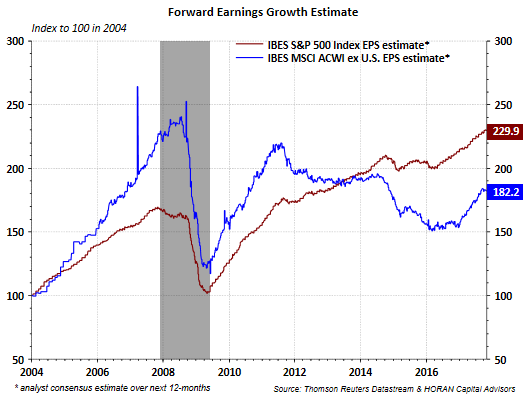
Turning to valuation, since 2011 again, the S&P 500 Index's price earnings ratio began to increase at a faster rate than the ACWX price earnings ratio as can be seen below. Cheaper valuation does not necessarily mean higher returns; however, in the second chart, the steeper slope of the blue line (ACWX earnings estimates) signifies ACWX earnings are growing at a faster rate than those of the S&P 500 Index.


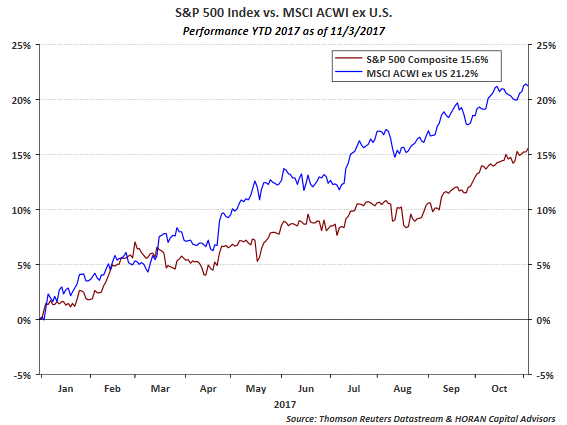
And lastly, the long term performance chart at the beginning of the post obscures the shorter term performance. The below chart compares the two indices performance for the year to date time period through 11/3/2017. Clearly, the MSCI ACWI ex US is on an outperformance run and whether it last or not is a valid question.

Outperformance in the U.S versus international tends to run in cycles that last for a multi year period and the recent international outperformance may just be the beginning. In yesterday's post it was noted the narrowing market in light of the strong returns since the financial crisis. My suggestion of evaluating ones asset allocation should also have investors potentially considering international exposure if under weight in this area given lower valuations and faster earnings growth in ex-U.S markets.
Disclosure: Firm and/or family long AAPL, AMZN, GOOGL/GOOG, MSFT, BA, HD
