July’s PCE and consumer spending data came out mostly in line with estimates which managed to keep the dollar supported from Friday’s Jackson Hole rally. However, the technicals on the intraday charts point to a near term correction in prices, which could put weak/new positions at risk. Watch for the pull back across EUR/USD, USD/JPY and GBP/USD which is likely to see renewed momentum build up as the short-term US dollar strength persists.
EUR/USD Daily Analysis

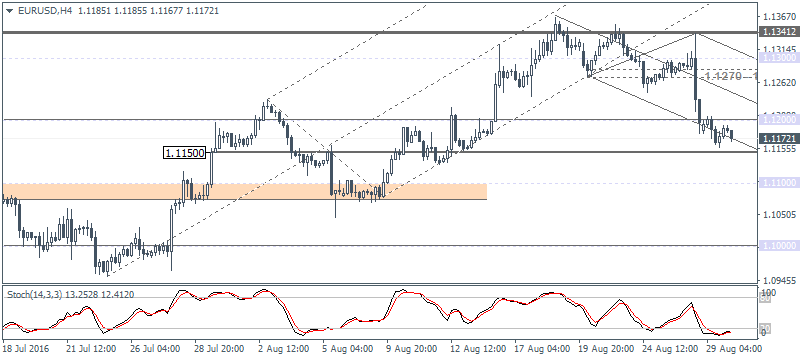
EUR/USD (1.1172): EUR/USD closed with a doji candlestick pattern yesterday, and its significance increases as the indecision comes after a few sessions of strong declines. On the 1-hour chart, we see a strong case for a bullish divergence with the Stochastics printing a higher low against the current lower low in price. This indicates a near-term correction towards 1.1270 - 1.1281 resistance level that needs to be validated to support the basis for further declines. To the downside 1.1150 remains the target in sight. Watch for a possible upside breakout above 1.1200 resistance for the correction to be triggered, while to the downside 1.1150 could see the downside target being reached while at the same time offering a potential support level for prices.
USD/JPY Daily Analysis

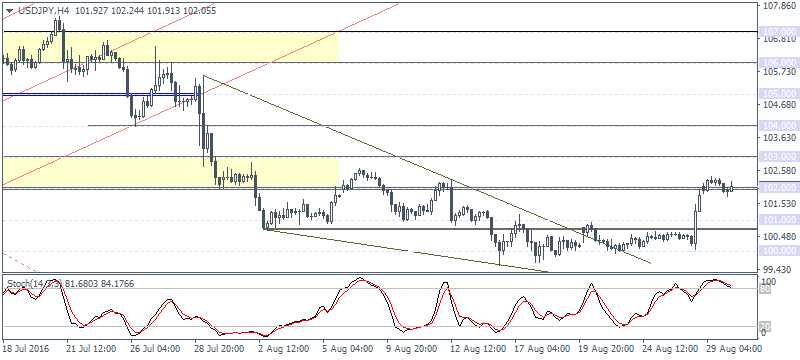
USD/JPY (102.05): USD/JPY moved in a very small range yesterday following the strong bullish candlestick from Friday. Prices are seen struggling near 102.00 resistance level indicative of a near term correction. The 1-hour chart on USD/JPY is flashing a bearish divergence above 102.00 and points to a dip in USD/JPY towards 101.00 - 100.80 support level that could be tested. As the bias remains to the upside, a retest of this support level could signal further upside towards 104.00.
GBP/USD Daily Analysis

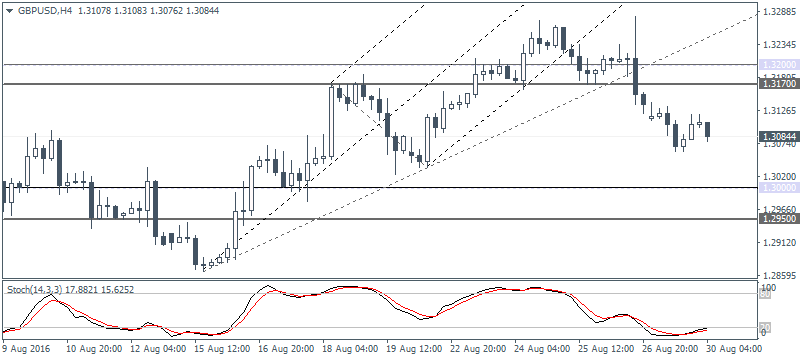
GBP/USD (1.3084): GBP/USD closed in a doji pattern yesterday with price seen caught within 1.3200 and 1.3000 levels. The price action on the 1-hour chart is similar to that of EUR/USD which signals a near-term correction towards 1.3170 - 1.3200. A retest of this broken support level for resistance could see GBP/USD renew its momentum for further downside as 1.3000 support remains a very likely target that could be tested.
Gold Daily Analysis

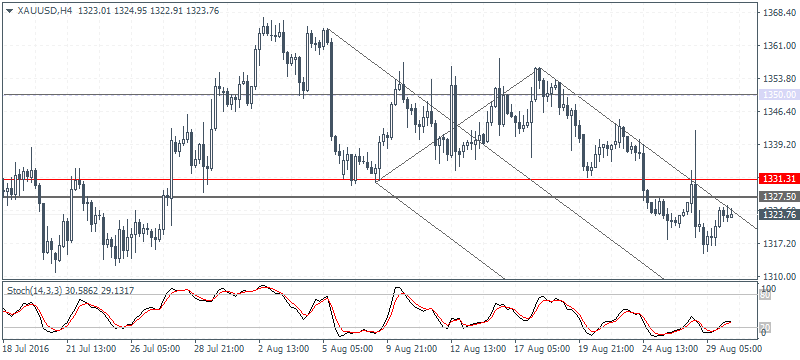
XAU/USD (1317.95):Gold prices closed positive yesterday, but the price action was very muted. With the resistance zone established near 1331.30 - 1327.50, we could expect gold prices to retest this resistance level. However, there is scope for prices to breakout higher above this resistance in which case; gold prices could be seen aiming for the $1350.00 handle once again.
