The Interpublic Group of Companies, Inc. (Interpublic) is a global advertising and marketing services companies. Interpublic’s companies specialize in consumer advertising, digital marketing, communications planning and media buying, public relations and specialized communications disciplines.
This is a stock and vol note on a company that just released earnings this AM. The results didn't make the market happy, but there's still an interesting phenomenon surrounding the vol.
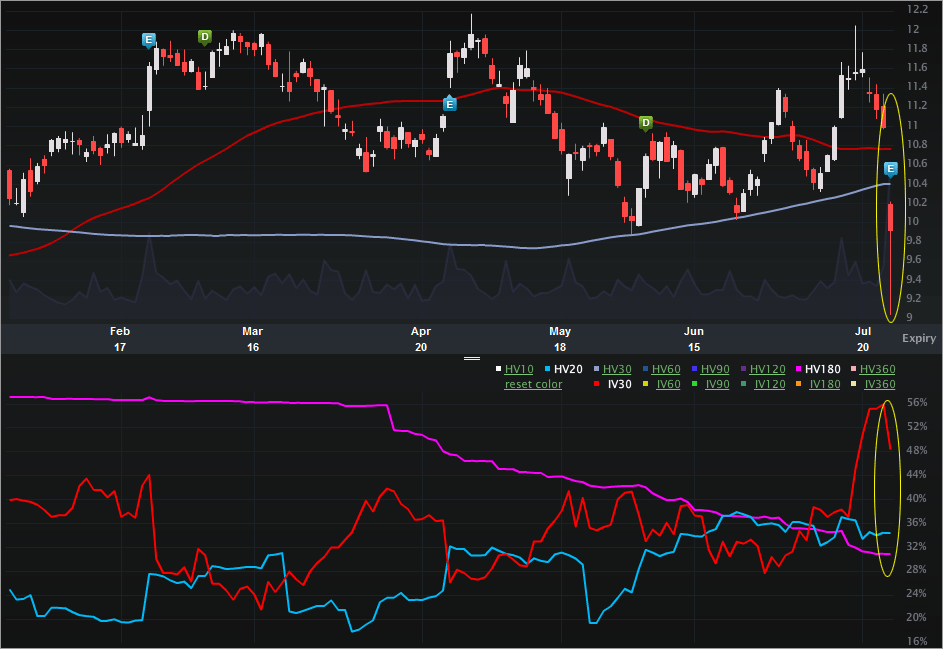
Let's start with the Charts Tab (six months), below. The top portion is the stock price, the bottom is the vol (IV30™ - red vs HV20™ - blue vs HV180™ - pink).
On the stock side, we can see the bumpy ride over the last six months, and then the abrupt drop today off of earnings. Here's a quick news summary:
NEW YORK (AP) -- Interpublic Group of Cos., a holding company for advertising and marketing agencies, said Thursday second-quarter net income fell 3 percent, hurt by some U.S. account losses in 2011 and the stronger dollar.
Net income beat expectations, but revenue fell short, and shares of Interpublic fell 9 percent in midday trading.
Interpublic, whose agencies include McCann Erickson and Draftfcb, said its net income fell to $99 million, or 22 cents per share. That compares with $101.7 million, or 19 cents per share, last year. Analysts expected 20 cents per share, according to FactSet.
Revenue fell 4 percent to $1.72 billion from $1.74 billion. Analysts expected revenue of $1.75 billion.
The company said account losses, including consumer products maker S.C. Johnson & Son Inc., and the effect of foreign currency translation hurt results.
Source: AP via Yahoo! Finance; Interpublic falls as 2Q revenue misses Street
Looking to the vol, we can see how extraordinarily high the vol elevated into this earnings report, easily a six-month high (but not an annual high). While I do note the vol crush after the earnings report, the implied is still quite elevated to both the short-term and long-term historical realized vols, as well as it's own six-month history. One caveat, historical vol is calculated close-to-close, so that HV20™ number will spike in tomorrow's chart.
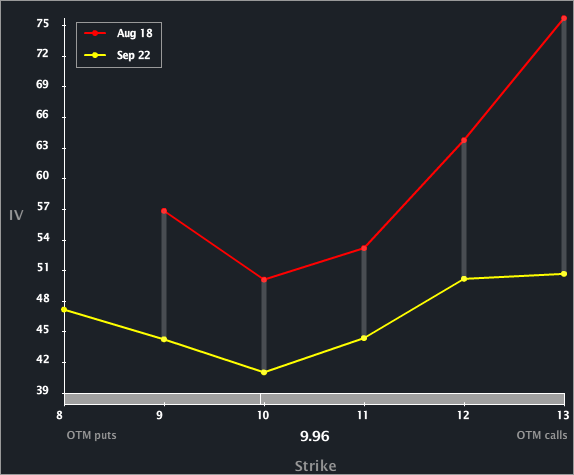
The really interesting part of this story comes from the Skew Tab, included below. 
We can see a rather obvious vol diff between the front and second month across all strikes. That is, while vol has come in for both expiries, the front has remained quite a bit elevated to the back.
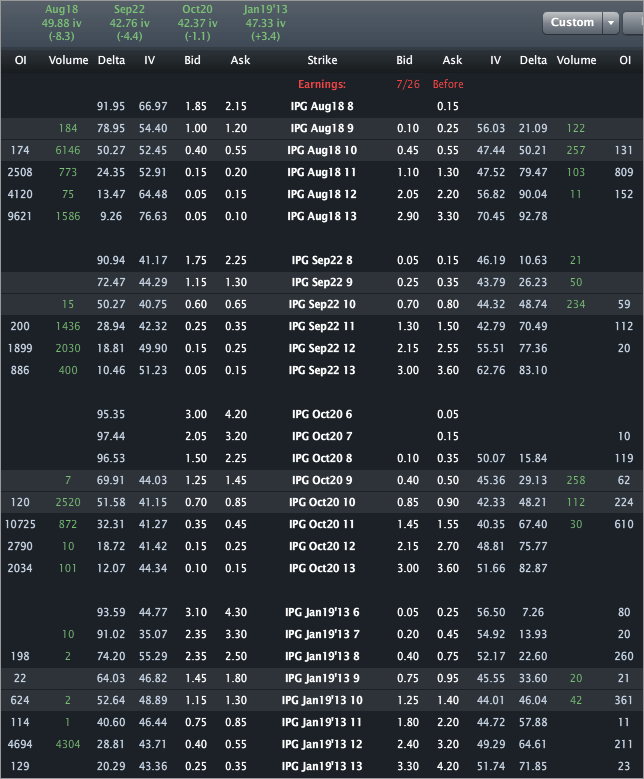
Finally, let's turn to the Options Tab for completeness.
Across the top we can see the monthly vols are priced to 49.88% and 42.76% for Aug and Sep, respectively. To give you feel for what normally happens for IPG, check out the snapshot below with the Symbol Summary and the vols by month (with changes), the day after the last earnings cycle (4-26-2012).
Last time the vol in the front fell considerably more than the second month and left the back elevated to the front. This is actually pretty normal, or in English, the action today is a bit abnormal. Pretty cool...
This is trade analysis, not a recommendation.
- English (UK)
- English (India)
- English (Canada)
- English (Australia)
- English (South Africa)
- English (Philippines)
- English (Nigeria)
- Deutsch
- Español (España)
- Español (México)
- Français
- Italiano
- Nederlands
- Português (Portugal)
- Polski
- Português (Brasil)
- Русский
- Türkçe
- العربية
- Ελληνικά
- Svenska
- Suomi
- עברית
- 日本語
- 한국어
- 简体中文
- 繁體中文
- Bahasa Indonesia
- Bahasa Melayu
- ไทย
- Tiếng Việt
- हिंदी
Interpublic Group (IPG) - Disapointing Earnings Create Vol Opportunity
Published 07/27/2012, 02:28 AM
Updated 07/09/2023, 06:31 AM
Interpublic Group (IPG) - Disapointing Earnings Create Vol Opportunity
3rd party Ad. Not an offer or recommendation by Investing.com. See disclosure here or
remove ads
.
Latest comments
Install Our App
Risk Disclosure: Trading in financial instruments and/or cryptocurrencies involves high risks including the risk of losing some, or all, of your investment amount, and may not be suitable for all investors. Prices of cryptocurrencies are extremely volatile and may be affected by external factors such as financial, regulatory or political events. Trading on margin increases the financial risks.
Before deciding to trade in financial instrument or cryptocurrencies you should be fully informed of the risks and costs associated with trading the financial markets, carefully consider your investment objectives, level of experience, and risk appetite, and seek professional advice where needed.
Fusion Media would like to remind you that the data contained in this website is not necessarily real-time nor accurate. The data and prices on the website are not necessarily provided by any market or exchange, but may be provided by market makers, and so prices may not be accurate and may differ from the actual price at any given market, meaning prices are indicative and not appropriate for trading purposes. Fusion Media and any provider of the data contained in this website will not accept liability for any loss or damage as a result of your trading, or your reliance on the information contained within this website.
It is prohibited to use, store, reproduce, display, modify, transmit or distribute the data contained in this website without the explicit prior written permission of Fusion Media and/or the data provider. All intellectual property rights are reserved by the providers and/or the exchange providing the data contained in this website.
Fusion Media may be compensated by the advertisers that appear on the website, based on your interaction with the advertisements or advertisers.
© 2007-2024 - Fusion Media Limited. All Rights Reserved.
