
Integer Holdings Corporation (NYSE:ITGR) reported third-quarter 2019 adjusted earnings of $1.20 per share, which surpassed the Zacks Consensus Estimate of $1.06 by 13.2%. The bottom line also improved 13.2% on a year-over-year basis.
Revenues declined 0.5% year over year to $303.6 million on a reported basis. Moreover, the top line missed the Zacks Consensus Estimate by 2.9%.
Segmental Analysis
Integer Holdings operates through two segments — Medical Sales and Non-Medical Sales.
Medical Sales
At the segment, reported revenues were $289.4 million, down 1.1% year over year. Revenues declined 0.9% from the prior-year quarter on an organic basis.
Medical Sales has three sub-segments — Advanced Surgical, Orthopedics and Portable Medical (AS&O); Cardio and Vascular; and Cardiac/Neuromodulation.
Advanced Surgical, Orthopedics and Portable Medical
Integer Holdings’ Advanced Surgical, Orthopedics & Portable Medical segment has been divested to Viant. Consequently, revenues at the segment include net sales from the acquirer Viant under supply agreements associated with the divestiture.
Revenues amounted to $34.3 million, up 4.6% from the prior-year quarter. Further, the metric improved 4.7% on an organic basis. Per management, an increase in the advanced surgical base products and new product launches in portable medical contributed to the upside.
Cardio and Vascular
Revenues at the segment totaled $148.6 million, down 1.1% from the prior-year quarter and 0.7% organically. Per management, revenues decreased thanks to peripheral vascular and structural heart growth. However, an end of life electrophysiology program, witnessing the largest quarter decline to date, offset the downside.
Cardiac/Neuromodulation
Revenues at this segment totaled $106.5 million, down 2.8% from the prior-year quarter and also on an organic basis. This can be attributed to neuromodulation customer demand shift to the fourth quarter and flat cardiac rhythm management sales.
Non-Medical Sales
Reported revenues at the segment totaled $14.2 million, up 13.8% on both year over year and organic basis.
Integer Holdings Corporation Price, Consensus and EPS Surprise
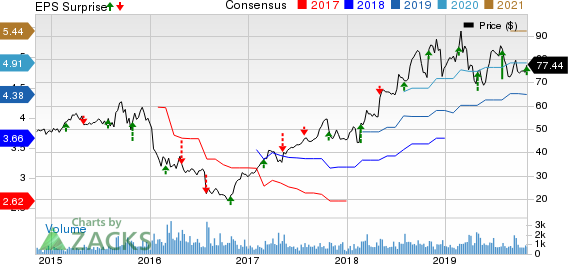
Integer Holdings Corporation price-consensus-eps-surprise-chart | Integer Holdings Corporation Quote
Margin Analysis
Integer Holdings generated a gross profit of $93.4 million in the third quarter up 1.6% year over year. As a percentage of revenues, gross margin in quarter expanded 70 bps to 30.8%.
Selling, general and administrative expenses (SG&A) were $32.9 million, down 3.4% year over year.
Research, development and engineering costs grossed $11.7 million in the quarter, down 4.1% year over year.
Total operating income amounted to $46.5 million, up 12.1% year over year. Adjusted income from operations totaled $40 million, improving 14% year over year.
Operating margin in the quarter under review was 15.3%, up 170 bps year over year.
Guidance Revised
For 2019, adjusted earnings per share are now expected in the range of $4.55-$4.65 (up from the previously guided range of $4.25-$4.45 per share), indicating an improvement of 20-22% from the previous year. The mid-point of the latest guidance range of $4.60 is higher than the Zacks Consensus Estimate of $4.39.
On a reported basis, Integer Holdings expects 2019 earnings to range between $3.22 and $3.32 (up from the prior band of $2.89-$3.09 per share).
For 2019, the company continues to expect reported revenues between $1.27 billion and $1.28 billion. On an adjusted basis, the company expects revenues in the same band, indicating an improvement of 4-5.5% from the previous year. Notably, the mid-point of the guidance is in line with the Zacks Consensus Estimate of $1.27 billion.
Adjusted income from operations is anticipated between $150 million and $154 million (up from the previously guided range of $140-$147 million).
For fourth-quarter 2019, the company projects adjusted earnings per share in the range of $1.13-$1.23, indicating an improvement of 9-18% from the prior-year quarter. Further, revenues are estimated to range between $333 million and $348 million for the same timeframe, indicating an improvement of 10-15% from the year-ago quarter.
Summing Up
Integer Holdings exited the third quarter on a mixed note, wherein the bottom line beat the Zacks Consensus Estimate, while the top line missed the same.
The company gains from its Advanced Surgical, Orthopedics and Portable Medical product line. Strong demand across key areas like structural heart and peripheral vascular is an added positive. Management is optimistic about the divestiture of its AS&O product line. An upbeat outlook for 2019 and expansion in both gross and operating margins buoy optimism on the stock. Integer Holdings also paid portion of its debt in the quarter under review.
Meanwhile, Integer Holdings’ Cardio & Vascular product line exhibited a dismal performance in the quarter under review.
Zacks Rank
Currently, Integer Holdings carries a Zacks Rank #4 (Sell).
Earnings of Other MedTech Majors at a Glance
Some better-ranked stocks which reported solid results this earning season are Edwards Lifesciences (NYSE:EW) , Thermo Fisher Scientific Inc. (NYSE:TMO) and ResMed Inc. (NYSE:RMD) , each carrying a Zacks Rank #2 (Buy). You can see the complete list of today’s Zacks #1 Rank (Strong Buy) stocks here.
Edwards Lifesciences delivered third-quarter 2019 adjusted EPS of $1.41, outpacing the Zacks Consensus Estimate by 15.6%. Third-quarter net sales of $1.09 billion beat the Zacks Consensus Estimate by 5.5%.
Thermo Fisher delivered third-quarter 2019 adjusted EPS of $2.94, which surpassed the Zacks Consensus Estimate by 2.1%. Revenues of $6.27 billion outpaced the Zacks Consensus Estimate by 1.3%.
ResMed reported third-quarter 2019 adjusted EPS of 93 cents, which beat the Zacks Consensus Estimate of 87 cents by 6.9%. Revenues were $681.1 million, surpassing the Zacks Consensus Estimate by 3.6%.
7 Best Stocks for the Next 30 Days
Just released: Experts distill 7 elite stocks from the current list of 220 Zacks Rank #1 Strong Buys. They deem these tickers “Most Likely for Early Price Pops.”
Since 1988, the full list has beaten the market more than 2X over with an average gain of +24.5% per year. So be sure to give these hand-picked 7 your immediate attention.
Thermo Fisher Scientific Inc. (TMO): Free Stock Analysis Report
Integer Holdings Corporation (ITGR): Free Stock Analysis Report
ResMed Inc. (RMD): Free Stock Analysis Report
Edwards Lifesciences Corporation (EW): Free Stock Analysis Report
Original post
Zacks Investment Research