
On May 3, the bond market fired the proverbial "shot heard ‘round the world.” Treasury yields began a two-month climb to levels not seen in almost two years. Many analysts proclaimed the end of the 30+ year interest rate decline. The true significance in the yield rally isn’t that the long-wave deflationary trend in interest rates is over, however. Rather, it’s that the commencement of long-term inflation is within sight.
Downtrend Still Intact
While the rally in Treasury yields does have longer-term significance, it’s still far too early to assume the downtrend in yields is over. As we’re still some 15 months away from the bottom of the 120-year cycle of inflation/deflation, we can only assume the downward trend in interest rates remains intact. Additionally, as real estate analyst Robert Campbell has pointed out, “until the actions of the Fed speak otherwise, Fed policy is currently working to push mortgage rates down.”
The rally in Treasury yields, while impressive, should be put into context with the longer-term yield trend. Here’s what the Treasury Yield Index (TNX) looks like from the vantage point of a two-year chart. In this relative short-term chart you can clearly see the attempt yields have made in establishing a new rising trend in relation to the steep drop in 2011-2012.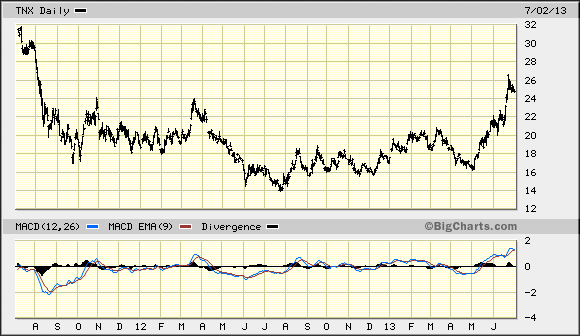
It’s only when we examine the long-term monthly chart of TNX that the true long-term trend becomes clear. The downtrend line that can be drawn by connecting the yield peaks from 1996 through 2011 hasn’t even been broken yet. The interest rate downtrend is therefore presumed to be still in force. It likely won’t be until after October 2014, when the Kress mega cycle bottoms, that we’ll finally see this downtrend broken.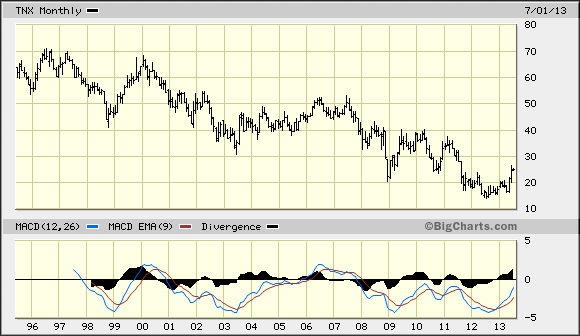
Historical Comparisons
What, then, is the ultimate significance of the sharp rally in bond yields? The spike in yields can only be appreciated by making historical comparisons with markets that behaved in a similar fashion. For instance, gold was in a similar long-term downtrend from 1981 through 1999 when, in the autumn of ’99, the yellow metal unexpectedly launched a vigorous rally from its long-term low of nearly $250/oz. to a high of over $330/oz. in just a few short weeks (see chart below). This wasn’t the official beginning of gold’s long-term bull market, which would actually begin less than two years later. It was, however, an advance warning that a major change of gold’s long-term trend was in the making.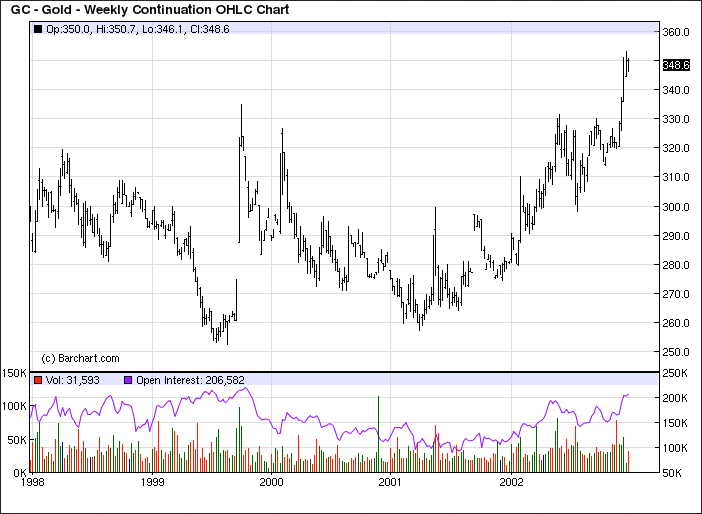
Gold And Bonds
Comparing gold with bonds isn’t as dissimilar as some may think, for both are excellent barometers of longer-term global liquidity and inflation/deflation expectations. Of the two, interest rates are a more important indicator of inflation and deflation, so it will be especially important to monitory the interest rate trend in the coming months as we draw closer to the 120-year cycle bottom.
The ultimate meaning behind the short-term rally in Treasury yields can only be known with certainty after the facts have become clear. It’s still far too early to discern what those facts may be. Based on historical examples, however, it’s probable that the yield rally is a “shot across the bow” preliminary to the beginning of a new long-term inflationary trend starting in late 2014/early 2015.
U.S. Economy
The selling pressure which hit stocks and bonds in June left the U.S. retail economy unscathed.
Among the individual corporate-stock components of the New Economy Index (NEI), which measures the real-time strength of the economy, only Wal-Mart (WMT) took a sizable tumble in June. Monster Worldwide (MWW), the jobs component of the NEI, also plunged last month but its stock price accounts for only a small amount of the index.
Meanwhile Amazon (AMZN), EBay (EBAY) and FedEx (FDX) -- the other important components of the index -- are in varying degrees of health or recovery. The signals reflected in the stock price performance of these three stocks alone are worth a hundred conventional economic indicators of the type relied on by mainstream economists.
The NEI reading for last week was in line with the reading of recent weeks, viz. the NEI is still holding on above its 12-week and 20-week moving averages. The interim uptrend for the index remains intact (below), therefore we still have a confirmed “buy” signal for the U.S. economy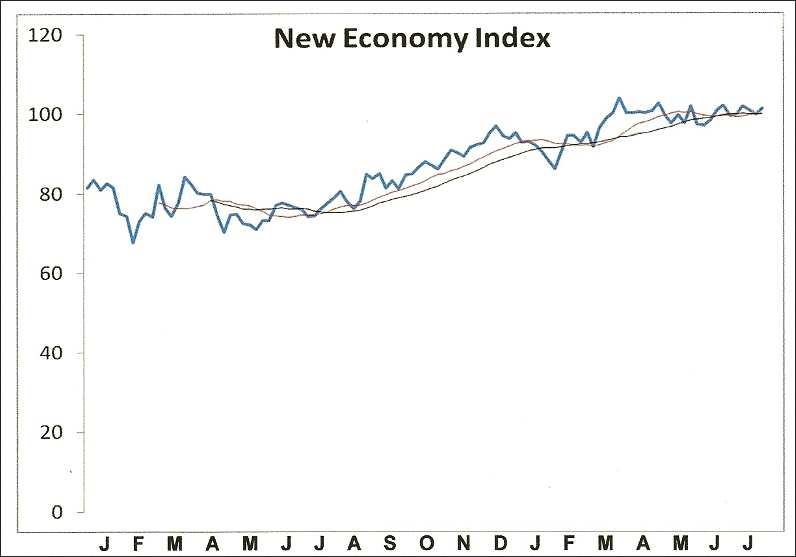
Deflationary pressure is expected to resurface as we head closer to the final “hard down” phase of the long-term Kress cycle in 2014, but for now those pressures are confined mainly to Europe and Asia and haven’t yet appeared in the U.S. The domestic retail economy, along with the consumer spending that supports it, is still firm.
- English (UK)
- English (India)
- English (Canada)
- English (Australia)
- English (South Africa)
- English (Philippines)
- English (Nigeria)
- Deutsch
- Español (España)
- Español (México)
- Français
- Italiano
- Nederlands
- Português (Portugal)
- Polski
- Português (Brasil)
- Русский
- Türkçe
- العربية
- Ελληνικά
- Svenska
- Suomi
- עברית
- 日本語
- 한국어
- 简体中文
- 繁體中文
- Bahasa Indonesia
- Bahasa Melayu
- ไทย
- Tiếng Việt
- हिंदी
Inflation’s Shot Across The Bow
Published 07/02/2013, 02:42 PM
Updated 07/09/2023, 06:31 AM
Inflation’s Shot Across The Bow
3rd party Ad. Not an offer or recommendation by Investing.com. See disclosure here or
remove ads
.
Latest comments
Install Our App
Risk Disclosure: Trading in financial instruments and/or cryptocurrencies involves high risks including the risk of losing some, or all, of your investment amount, and may not be suitable for all investors. Prices of cryptocurrencies are extremely volatile and may be affected by external factors such as financial, regulatory or political events. Trading on margin increases the financial risks.
Before deciding to trade in financial instrument or cryptocurrencies you should be fully informed of the risks and costs associated with trading the financial markets, carefully consider your investment objectives, level of experience, and risk appetite, and seek professional advice where needed.
Fusion Media would like to remind you that the data contained in this website is not necessarily real-time nor accurate. The data and prices on the website are not necessarily provided by any market or exchange, but may be provided by market makers, and so prices may not be accurate and may differ from the actual price at any given market, meaning prices are indicative and not appropriate for trading purposes. Fusion Media and any provider of the data contained in this website will not accept liability for any loss or damage as a result of your trading, or your reliance on the information contained within this website.
It is prohibited to use, store, reproduce, display, modify, transmit or distribute the data contained in this website without the explicit prior written permission of Fusion Media and/or the data provider. All intellectual property rights are reserved by the providers and/or the exchange providing the data contained in this website.
Fusion Media may be compensated by the advertisers that appear on the website, based on your interaction with the advertisements or advertisers.
© 2007-2024 - Fusion Media Limited. All Rights Reserved.