Upon last Wednesday's release of the Federal Open Market Committee's minutes, "talk" of tapering therein inherit, all eight components of BEGOS (Bond, Euro/Swiss, Gold/Silver/Copper, Oil, S&P 500) instantaneously dropped in 180° vertical unison like stones. Spanning that day's highs-to-lows, Gold succumbed by 35 points and the S&P's futures by 18 points, whilst Silver crossed below $20/oz. for the first time in better than three months (since 08 August).
Given such downside reaction to already terribly-dated information, we felt 'twas at the very least our humble duty to point out in Thursday's pre-open Commentary that those FOMC minutes were a full three weeks stale (from 30 October), the Economic Barometer since that time having tanked of its own accord, and thus such talk of tapering ought instead now again be tempered. In acknowledged relief thereto, the stock market, (along with some Wednesday evening help from Big Ben), accordingly regained the entirety of its dreadful loss on Thursday. And if you missed our prior missive, here is the now further updated state of the Econ Baro: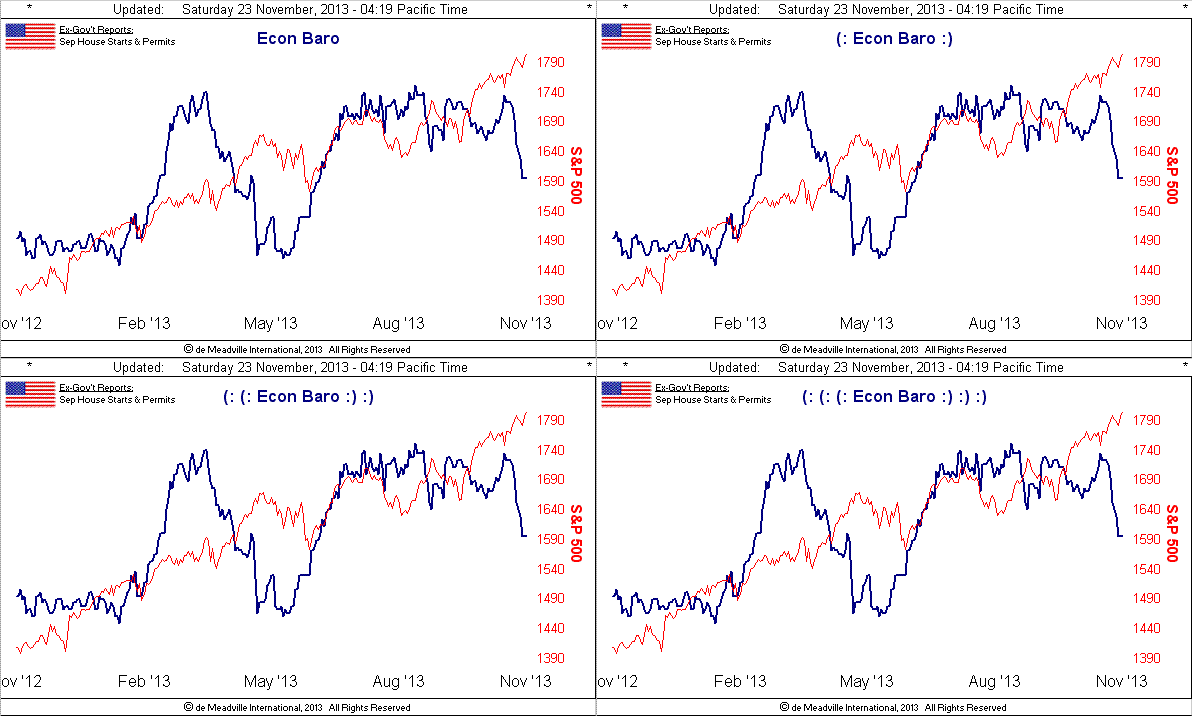
Others of the BEGOS bunch recovered as well on Thursday into yesterday (Friday), including Oil, Copper and the EuroCurrencies. But not Gold. Not even in the face of two straight days of Dollar decay could Gold get a decent bid, whilst all around recovered, reveling in the new paradigm that a bad economy breeds a good stock market. Gold could only finish the week mired lower at 1243. And rightly so -- in the small minds of those who took last week's penning of “Gold is Going Down! Dowwnn!! Dowwwnnn!!!” literally.
Whilst we are very grateful for that having been one of our more popular pieces, in response to a note from a valued reader I wrote as follows: "Given the debt, the debasement, the need for dough, the shrinking real workforce, the lack of real earnings, at some point the financial system will crack. Currency failure ought put Gold in fine stead." Or more to the point in again quoting our esteemed charter reader JGS: "Sumpthin's gonna happen."
How true 'twill be, especially when one sees a passing headline as did I on Friday which read: "Dow 20,000 here we come". Cue Maxwell the Pig to go "Wheeeeee!" Indeed just a singular down day in the equities markets has become so unusual that it too makes headlines: last Monday the S&P lost 6 points to which 'twas then reported that "Wall Street has finally succumbed to a bout of acrophobia." I say: "You ain't see nothing yet..."--(BTO, '74)
Has anybody noticed that packaged collateralized loan obligations are now holding record levels of so-called "covenant-lite" risky debt borne of the Black Swan era? Or that the OECD just cut its global growth forecasts not just for the EuroZone economies but for those emerging as well, and that there is the "potential" for another U.S. budget crisis? Ya think? Moreover, 'twas reported mid-week that ebbing in share prices, (despite the S&P's current 1804 level being an all-time high), is due to poor corporate earnings: anyone following our daily earnings season updates has already know this for weeks. But again, bad is good.
The lot of this -- riskier loan allocation, slowing economies, poor earnings -- from whence shall come the dough such that we can all still go? 'Tis only QE, you know. And yet the Happy Herd sees not such dilemma of debasement, for 'tis yet to work a wit back into the price of Gold, which for the week just past went "Dowwwnnn" 4%: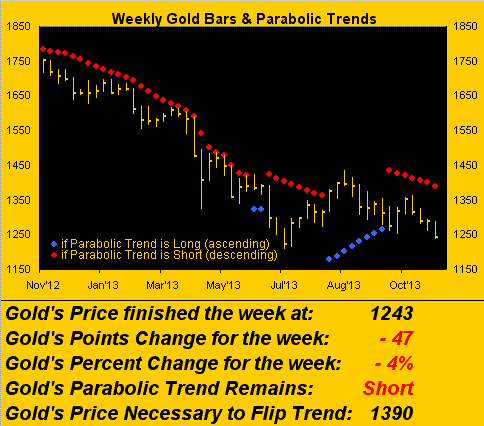
"Dowwwnnn!!!" 'Tis getting downright contagious. Indeed one more week of parabolic Short trend (red dots) will tie the prior eight-week run of parabolic Long trend (blue dots), barring Gold's putting on a mega-rally to eclipse that 1390 flip price in the Stateside holiday-shorted ensuing week. Further, Gold has not been in these lowly 1240 doldrums in the past 20 weeks, (albeit after closing at 1249 on 09 July it scampered up 185 points to 1434 by 28 August, or +15% in 36 trading days)
But then there are days like yesterday wherein Gold closed out the trading week with its second narrowest day of the year, spanning just eight points from low-to-high, or less than one-half of its current 18-point "expected daily trading range" (EDTR), which year-over-year has tracked as follows: 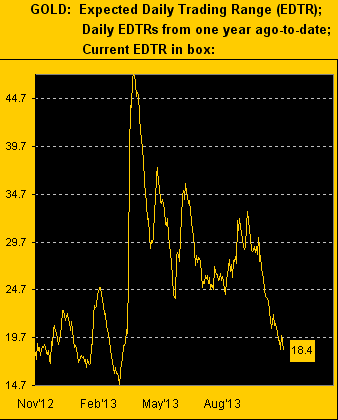
The only day with a tighter trading range year-to-date was 01 April, which seems entirely appropriate as this has been the Year of the Gold Fool. And yet, The Fool puts one in mind of the Emperor Claudius, whose cumbersome and seemingly foolish ways were, in hindsight, his very survival throughout some of the Roman Empire's most decadent and likewise turbulent times. Fortunately the analogy fits well as we Gold Fools too will out.
Still, Gold's trading ranges having returned to these more docile levels doesn't rule out its ability to leap better than 100 points as if with the flick of a switch by those very parties who have alarmingly pounded the price of Gold "Dowwwnnn" at times this year in the sharpest strikes of capitulative selling. And upon the recurrence of 100-points leaps, watch for the FinMedia pundits to concede that Gold had become well behind the curve of currency debasement such at the end of the day 'twas truly oversold.
'Course what they're currently not telling us is that since the depths of the aforementioned Black Swan some 268 weeks ago, 24 of them (almost 10%) have seen Gold soar better than 100 points from prior week's low to following week's high. To be sure, that has only occurred three times thus far in 2013 specifically, but 'tis only the True Fool who'd rule out a recurrence of same.
Meanwhile per our broadest of modern-day measures, we might take some encouragement from this next graphic of Gold and its once-stalwart bastion of support, the 300-day moving average: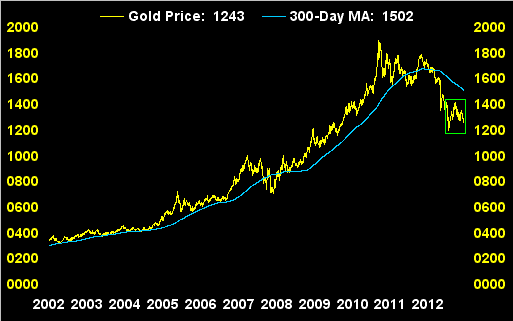
"Did you say 'encouragement', mmb?"
Indeed I did, Squire. Art's beauty lies in the eye of the beholder and that which is beholden above is a price having bottomed earlier in the year now more or less simply traipsing sideways, (per the boxed bit), whilst the average still declines. A "regressing to the mean" has to begin somewhere, and should there be here, a reclamation of 1500 would be most welcome, (albeit as 'twas also written in Thursday's Commentary: "...Still, Gold (1248.1) has broken below support sufficient that a retest of the year's low (1179) is not out of the question..."). One might sense there is technical pressure on Gold in anticipation of such retest and then the real buying shall commence. But by my purview, Gold's inevitably trading well beyond $2,000/oz. makes it perfectly fine to own it here at 1249, or at 1179, or at the Bottom of the Floor at 1578, or really anywhere sub-2000.
Meanwhile, with respect to the declining Econ Baro as shown at the outset, and in turn the necessity for ongoing monetary accommodation, in concert with the Dollar's sliding into week's end as the S&P and EuroCurrencies rose, as noted Gold itself simply languished rather than also recover. Perhaps odd because the Dollar's declining per strength in the EuroCurrencies ought naturally redound positively for Gold as well. 'Tis almost a case of "what's wrong with this picture" as we next go to the last 21 trading days for the Euro, the "soft-pegged" Swiss Franc, and Gold, each with their linear regression trendlines and baby blue dots that denote trend consistency. Seems like Gold's "Baby Blues" have been caught napping, indeed having overslept: 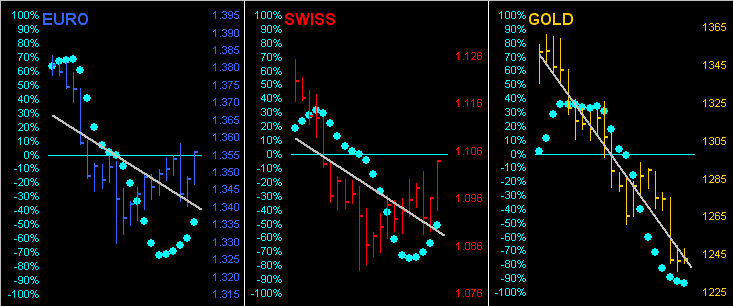
Also, from their 10-day trading profile perspectives, the Euro (as is the Swiss Franc) is near the top of its stack whilst Gold is near its bottom; again, 'tis odd: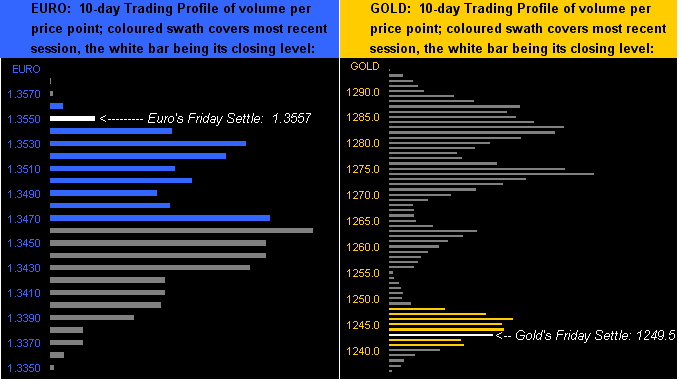
Or perhaps 'tis not odd for those in the camp who assert that if the S&P is rising, Gold can only be falling, (which as hardened readers of The Gold Update know is oft the exception). Here are the percentage performances of Gold and the S&P over the past 21 trading days (one month):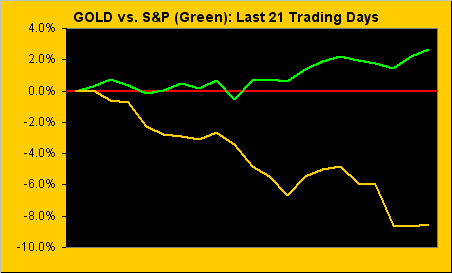
Moreover, the S&P's uncanny rise -- the lack of earnings support notwithstanding -- has actually not been a fluke if given that real money has been thrown at it over the last three months-to-date per our calculation of moneyflow vis-à-vis the stance of the Index. Because the moneyflow is regressed into S&P points, the chart below suggests the Index in fact ought be almost 100 points higher than currently 'tis, (but I personally would not take that Long bet): 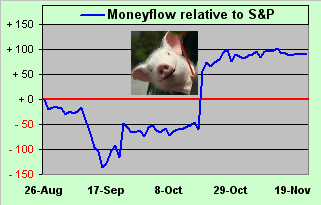
How curious all 'tis in the Year of the Gold Fool!
Toward closing, I've been looking forward to the ensuing week for sometime. True, 'tis Thanksgiving here StateSide, but there's more: we'll finally receive the last two pieces of the data that have been missing from the Econ Baro for more than a month due to our nanny state's shutdown: September's Housing Starts and Building Permits, which were due to have been originally released back on 17 October. All shall then be right with the Baro, even though as you've now seen 'tis in full plunge (!)
In Gold's bringing up the rear, if you frequent flyers out there have been noticing the lengthening lines of late to les toilettes d'avions, we've this from the Oh-No Not Again Department. You may recall some three weeks ago the bit about the 280 small (4oz.) bars of Gold found in the WC of a Fly Dubai jet. This apparently has become the "in thing to do" as we've now another 24 larger bars totaling better than 800 ounces having been found in the loo of a Jet Airways Boeing 737 moored in Calcutta. Leave it to our Indian friends to curry favour for higher preferred seating prices in the rear of planes!
- English (UK)
- English (India)
- English (Canada)
- English (Australia)
- English (South Africa)
- English (Philippines)
- English (Nigeria)
- Deutsch
- Español (España)
- Español (México)
- Français
- Italiano
- Nederlands
- Português (Portugal)
- Polski
- Português (Brasil)
- Русский
- Türkçe
- العربية
- Ελληνικά
- Svenska
- Suomi
- עברית
- 日本語
- 한국어
- 简体中文
- 繁體中文
- Bahasa Indonesia
- Bahasa Melayu
- ไทย
- Tiếng Việt
- हिंदी
In The Year Of The Gold Fool
Published 11/25/2013, 12:31 AM
Updated 07/09/2023, 06:31 AM
In The Year Of The Gold Fool
3rd party Ad. Not an offer or recommendation by Investing.com. See disclosure here or
remove ads
.
Latest comments
Hey Mark you have been wrong all along and now you want to look at what gold has done compared to S&P over last 21 days??? Big Deal, what has it done since it was at $1900? Down down down and yet you have been wrong wrong wrong all along.
Install Our App
Risk Disclosure: Trading in financial instruments and/or cryptocurrencies involves high risks including the risk of losing some, or all, of your investment amount, and may not be suitable for all investors. Prices of cryptocurrencies are extremely volatile and may be affected by external factors such as financial, regulatory or political events. Trading on margin increases the financial risks.
Before deciding to trade in financial instrument or cryptocurrencies you should be fully informed of the risks and costs associated with trading the financial markets, carefully consider your investment objectives, level of experience, and risk appetite, and seek professional advice where needed.
Fusion Media would like to remind you that the data contained in this website is not necessarily real-time nor accurate. The data and prices on the website are not necessarily provided by any market or exchange, but may be provided by market makers, and so prices may not be accurate and may differ from the actual price at any given market, meaning prices are indicative and not appropriate for trading purposes. Fusion Media and any provider of the data contained in this website will not accept liability for any loss or damage as a result of your trading, or your reliance on the information contained within this website.
It is prohibited to use, store, reproduce, display, modify, transmit or distribute the data contained in this website without the explicit prior written permission of Fusion Media and/or the data provider. All intellectual property rights are reserved by the providers and/or the exchange providing the data contained in this website.
Fusion Media may be compensated by the advertisers that appear on the website, based on your interaction with the advertisements or advertisers.
© 2007-2024 - Fusion Media Limited. All Rights Reserved.