Asia stocks sink as AI doubts batter tech; weak China data weighs
We hear a lot about the VIX and how volatility is low, but we rarely hear about the VIX's siblings: the CBOE SKEW Index and the CBOE S&P 500 Implied Correlation 2014. This is a shame because they are certainly worth listening and paying attention to. All three are based on options on the S&P 500 and its constituents.
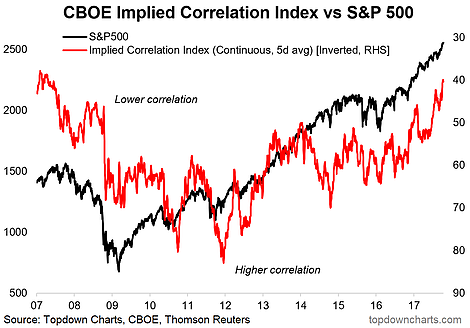
Looking at the charts, the first is the implied correlation index. While the level seems to go through longer term cycles (albeit this index has only been around since 2007), the cyclical swings in implied correlations appear to give clues on the market outlook and can enhance market timing strategy. For example, (note the chart shows the indicator inverted) you tend to see spikes in implied correlations around a market bottom and a drop in correlations around a short-term top. So it's important to note how the implied correlation index has fallen to levels last seen around the 2007 market top.
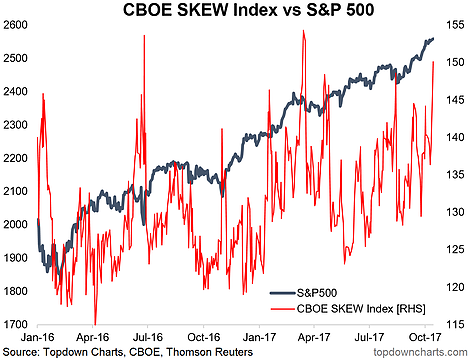
As for the SKEW index, there's a few nuances and subtleties around it, but in basic terms it is a gauge of tail risk pricing or the implied likelihood of a so-called "Black-Swan" event. I basically think of it as a measure of the demand for tail risk hedging. For example, you saw it spike around Brexit and the US 2016 election, it often also spikes during a selloff/correction as investors rush to put on hedges. One interesting observation I would make is that you look at it lately and there is an apparent uptrend in the SKEW... matching that seen in the S&P 500 index. In other words it looks like demand for tail risk hedges are rising as the market (and valuations) head higher and as the business cycle matures.
To sum up, the implied correlation index can be useful in market timing, while the skew index provides an insight into tail risk hedging demand and thus a broader view of market sentiment. Taken together we can see an uptrend in tail risk hedging demand, and a fall in implied correlations which is often a tactical bearish signal. So the combined message is a cautions one that would seem to line up with the various and growing list of bearish signals we've seen lately.
The implied correlation index often falls to a short-term extreme low around a market top, and spikes during a sell-off or correction. This makes sense as correlations often converge towards 1 in a market panic.

The SKEW index has been on an uptrend, reflecting rising demand for tail risk hedging as the market heads higher, with spikes reflecting the swings in investor sentiment.

