The US Dollar traded mixed against other currencies. The Pound Sterling (GBP) closed 0.77% lower against the Dollar on Friday as different EU leaders suggested that the next stage of the Brexit trade deal negotiations would get tougher. The South African Rand (ZAR) closed 2.68% stronger against the US Dollar ahead of the ruling party’s ANC congress on Sunday where they were due to vote for their candidate for the upcoming presidential elections.
Gold traded slightly higher on Friday. While US Treasury yields were lower optimism about the coming tax reform limited its upside. WTI oil closed on Friday higher as the Baker Hughes US oil rig count showed four less operating oil rigs in the US, decreasing the number of operating oil rigs for the first time in six weeks.
US equity indices traded higher as the positive expectations on a passing of the US tax reform led the S&P 500 (US 500) and NASDAQ (US Tech 100) to new all-time highs.
Bitcoin raced close to the level of $20,000 over the weekend but retraced back to levels around 19 thousand. On Monday the CME Group (NASDAQ:CME) is due to launch its Bitcoin futures, which ETF issuers hope will increase their chances of bundling Bitcoin in SEC approved ETFs. While Bitcoin futures of Cboe will be cash settled according to prices of the less known exchange Gemini, which was started by the Winklevoss brothers, who in turn are said to be themselves Bitcoin billionaires, the CME future Bitcoin Reference Rate (BRR) will take its data from several of the major established cryptocurrency exchanges.
On Monday the European Union (EU) publishes the Harmonised Index of Consumer Prices (HICP), while in Germany the influential IFO business and economic condition survey will be released. The United Kingdom is due to release its CBI Industrial Trends Survey. In the US the Housing Market Index will be released. Chip maker Micron is due to release its quarterly earnings after markets close.
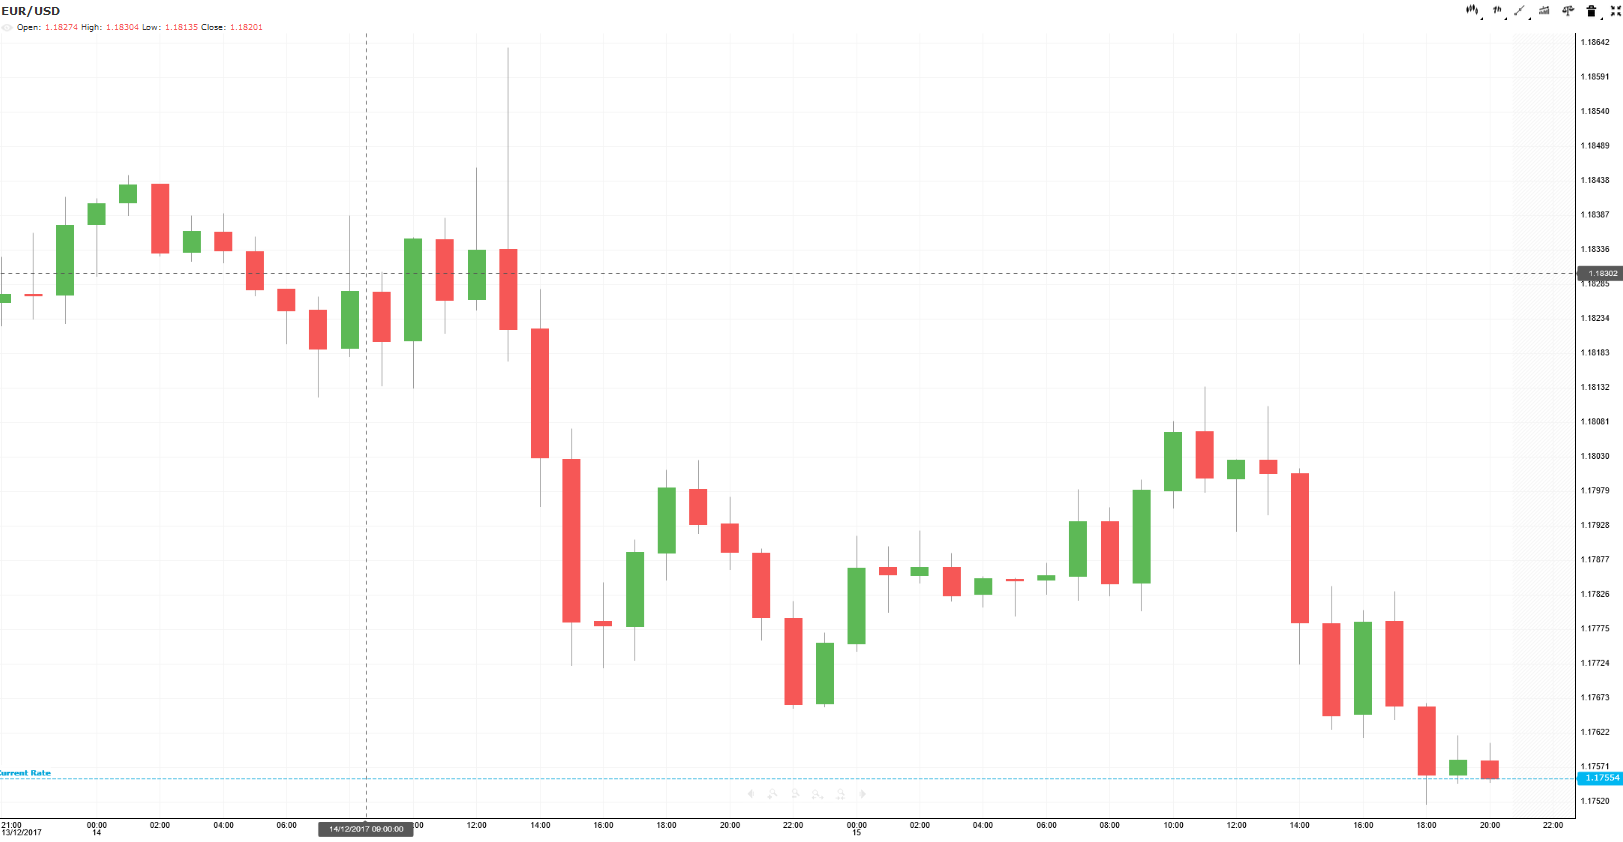
The EUR/USD closed lower on Friday, making it the third week in a row with declining exchange rates. In the European Union the import/export statistics shows that over the last month the exports fell by 2.4% (previous +1.1%) and imports increased by 0.6% (previous -1.2%). In the US the Empire State General Business Conditions was at the expected level of 18.0, while industrial production and capacity utilization were with 0.2% and 77.1% respectively 0.1% lower than expected.
On Monday the European Union (EU) publishes the Harmonised Index of Consumer Prices (HICP), while in Germany the influential IFO business and economic condition survey will be released.

Pivot: 1.179 Support: 1.173 1.1715 1.168 Resistance: 1.179 1.181 1.1845
Scenario 1:short positions below 1.1790 with targets at 1.1730 & 1.1715 in extension.Scenario 2:above 1.1790 look for further upside with 1.1810 & 1.1845 as targets.Comment:the RSI advocates for further decline.
Gold
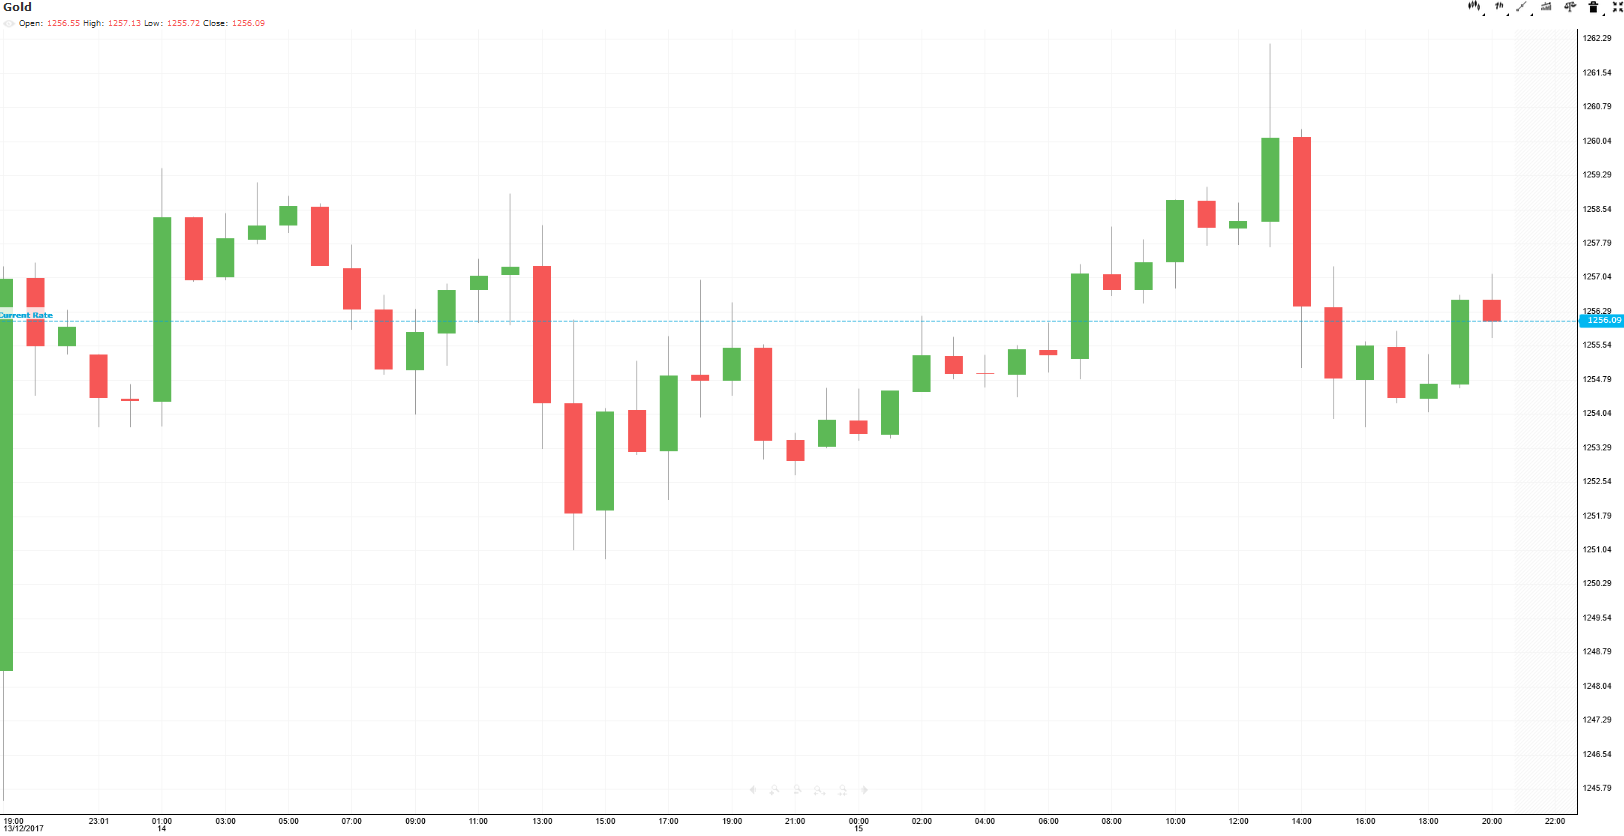
Gold slightly recovered on Friday, allowing the precious metal to close the week in the green after falling for three consecutive weeks. However gains were limited as the markets saw the US tax reform back on track. Somewhat lower US Treasury yields helped gold against the positive sentiment from the tax reform.
This week in terms of US data will start with the Housing Market Index on Monday, however the most regarded data such as Durable Goods New Orders and Core PCE Price Index are due to be released on Friday.

Pivot: 1250.5 Support: 1250.5 1245 1240 Resistance: 1262 1267 1272
Scenario 1:long positions above 1250.50 with targets at 1262.00 & 1267.00 in extension.Scenario 2:below 1250.50 look for further downside with 1245.00 & 1240.00 as targets.Comment:the RSI is supported by a bullish trend line.
WTI Oil
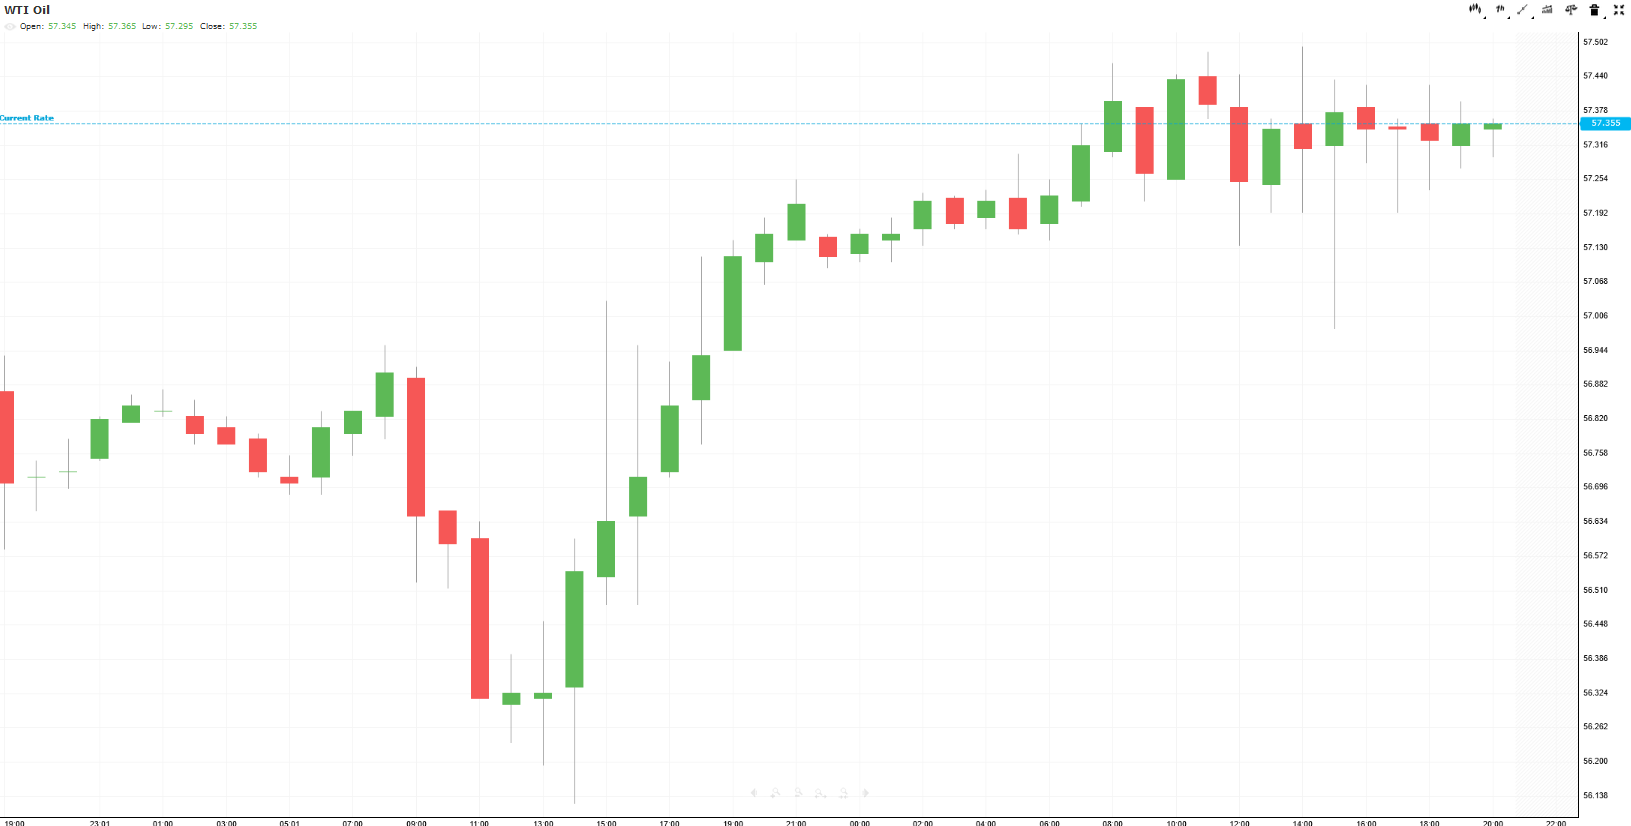
Oil settled higher on Monday as according to Baker Hughes the number of operating oil rigs in the US fell for the first time in six weeks by 4, bringing the number of operating oil rigs to 747. However oversupply pressure still persists as the International Energy Agency (IEA) pointed out in its report that the US oil production is set to rise in the coming year.
On Tuesday the American Petroleum Institute (API) will release oil stockpile figures, followed by the Energy Information Administration (EIA) on Wednesday.

Pivot: 57 Support: 57 56.65 56.1 Resistance: 57.85 58.15 58.55
Scenario 1:long positions above 57.00 with targets at 57.85 & 58.15 in extension.Scenario 2:below 57.00 look for further downside with 56.65 & 56.10 as targets.Comment:the RSI is mixed to bullish.
US 500
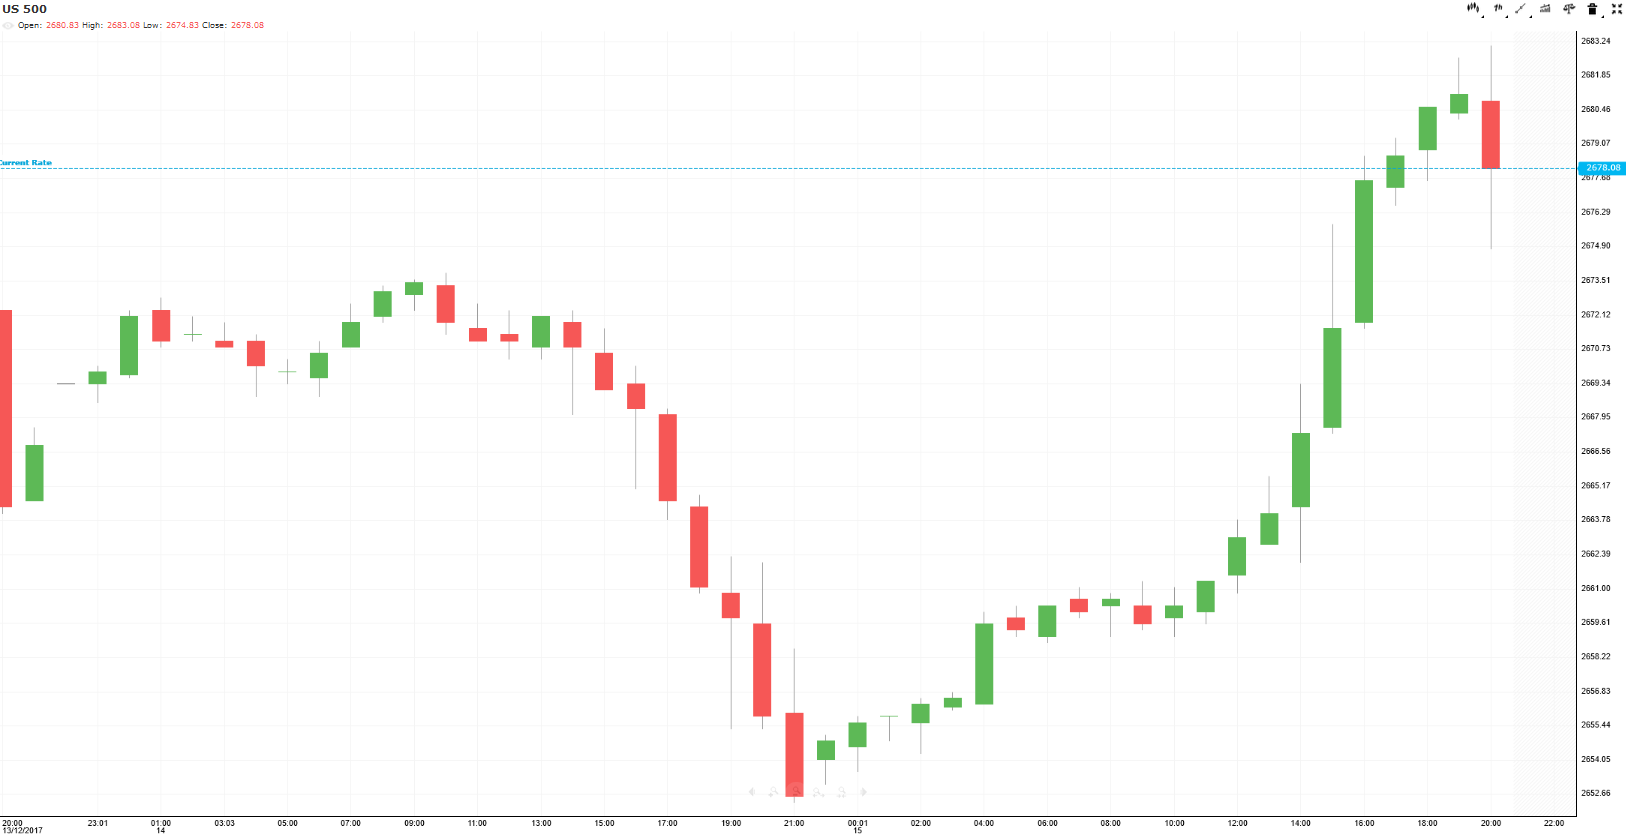
US equity indices closed higher on optimism that the tax reform could be actually passed soon, helping the S&P 500 (US 500) and NASDAQ (US Tech 100) reach new record highs. Best performing stocks were in the biotech (US Biotech ETF +1.31%) and bank (US Banks ETF +1.24%). Costco (NASDAQ:COST) (+3.0%) was up supported by better than expected quarterly numbers.
On Monday the Housing Market Index will be published, followed by further housing and mortgage market data on Tuesday and Wednesday. On Friday Durable Goods New Orders, Core PCE, personal income, consumer spending and consumer sentiment data will be released.
On Monday Micron is set to release quarterly earnings after market close, while Nike (NYSE:NKE) is due to release its numbers on Thursday.

Pivot: 2667.5 Support: 2667.5 2658 2651.5 Resistance: 2685 2690 2690
Scenario 1: long positions above 2667.50 with targets at 2685.00 & 2690.00 in extension. Scenario 2: below 2667.50 look for further downside with 2658.00 & 2651.50 as targets. Comment: the RSI broke above a bearish trend line.
