[Note to Readers. Thanks to all those who have written. All is well. I have been, as always, actively following the markets and trading every day. There have also been some major opportunities for clients, and that is my first duty.
I sometimes forget that we have a community of interest here and I have an obligation to explain what is going on. I'll try to do a better job on that front. While I am always in touch with the markets and I have been trading every day, writing the weekly article takes another six hours or so. When I get behind, I then have a moving target of events. With this post I'll try to catch up with my current thinking. In my next few articles I'll elaborate and also post a few specific trade ideas to illustrate what I think is working. I'll be back on schedule with the weekly updates this coming weekend.]
This week has brought together what we might call a confluence of concern. How worried should we be?
I will abbreviate the micro data points a bit in order to emphasize broad themes. The main current worries are the following:
- Greece and the possibility of a debt default;
- Worldwide economic growth;
- Rising gasoline prices.
These are all valid concerns -- things that we should try to analyze and to quantify.
I'll take a deeper look in the conclusion, but let us first do our regular review of recent news and data.
Background on "Weighing the Week Ahead"
There are many good sources for a comprehensive weekly review. You cannot read all of them. It is actually possible for your work to be counter-productive as I tried to explain in Read a Lot, Get Squat. Instead of trying to drink from a fire hose, why not be more selective?
I single out what will be most important in the coming week. My theme is an expert guess about what we will be watching on TV and reading in the mainstream media. It is a focus on what I think is important for my trading and client portfolios.
Unlike my other articles, I am not trying to develop a focused, logical argument with supporting data on a single theme. I am sharing conclusions. Sometimes these are topics that I have already written about, and others are on my agenda. I am trying to put the news in context.
Readers often disagree with my conclusions. Do not be bashful. Join in and comment about what we should expect in the days ahead. This weekly piece emphasizes my opinions about what is really important and how to put the news in context. I have had great success with my approach, but feel free to disagree. That is what makes a market!
Last (two) Week's Data
Each week I break down events into good and bad. Often there is "ugly" and on rare occasion something really good. My working definition of "good" has two components:
- The news is market-friendly.
- It is better than expectations.
A valued reader, noting the high unemployment levels, asked how I can ever write about employment as "good." I agree that we are far below what is needed for economic health and general prosperity, but that is not my mission. I am explaining how events will be interpreted by the market. You might disagree on political or policy grounds, but that is not the subject. When the news is "less bad" it is market-friendly.
The Good
There was some very good news this week. I'm sticking to the most important items.
- Initial jobless claims. The latest reports (one in the survey period for next week's jobs report, the other not) were both excellent. This is important data, more current than most. The decrease in initial claims encourages us about one half of the problem: job losses. We also must consider job creation.
- ISM services was excellent. ISM manufacturing was lower than expected, but still consistent with GDP growth of 3.3%.
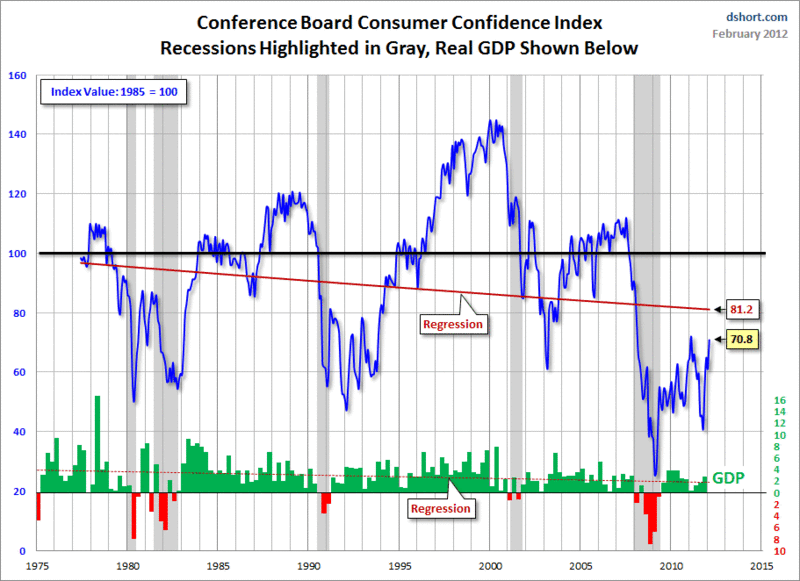
- Consumer confidence -- both the Michigan sentiment indicator and the Conference Board version show significant improvement. These indicators are normally good coincident measures of employment, but are also influenced by gas prices and, especially last year, political events. I am calling this as market-friendly (and that was the reaction), but everyone should keep in mind the excellent historical perspective from Doug Short:

The Bad
- The payroll tax cut (essentially market-friendly) might lead to another pre-election showdown on the debt ceiling. See the story in The Hill, a source you should be following through the election season.
- Rail volume is lower. This is mostly due to lower coal consumption, but still something to watch. Check out the GEI analysis.
- Gas prices are a lot higher. This is a tax on US consumers, with no benefit from government payments. I have been citing this for many weeks as a source of concern, and it deserves our attention.
Let us take up the key arguments on the main themes, wondering how worried we should be.
Greece
As I write this article, there is continuing concern about how many participants will sign off on the Greek bond haircuts and as a result, whether Greece will get the needed cash infusion to meet obligations on March 20th. If the participant level is lower than 90%, it may trigger credit default swaps.
This is all old news. The credit default swap risk is widely known and already discounted in the market. Major media are seizing on this as the story, but that is not accurate.The recent ECB actions have taken systemic risk off the table, so it is now a question of impact on the European economy, and second-order effects elsewhere.
Recession Forecasts
The ECRI is sticking to its recession forecast, although the latest explanation (see the video here) has switched to coincident indicators.The ECRI made a forecast of an imminent recession in September, stating that we might already be in recession. Readers of "A Dash" know that I removed the ECRI from our indicator list in May, five months earlier, when their indicators were still bullish. This decision was based strictly on the past record compared to other methods. I understand that some people think the ECRI has an astounding record with no false positives, but they need to look more closely at the data.
The latest ECRI argument does not argue that anything is getting worse -- and that is the test for the official recession dating by the NBER (a non-profit, non-government body). The ECRI argues that the rate of growth is slowing. They seem to feel that this is part of an inevitable downward spiral.
Simply put, the team from PowerStocks research has done a much better job of analyzing all of the models that rely on the rate-of-growth approaches. For the absolute best discussion of this topic, you just need to follow Doug Short. He has provided an open forum for all sides.
The ECRI argument. Arguments pro and con here, here, and here.
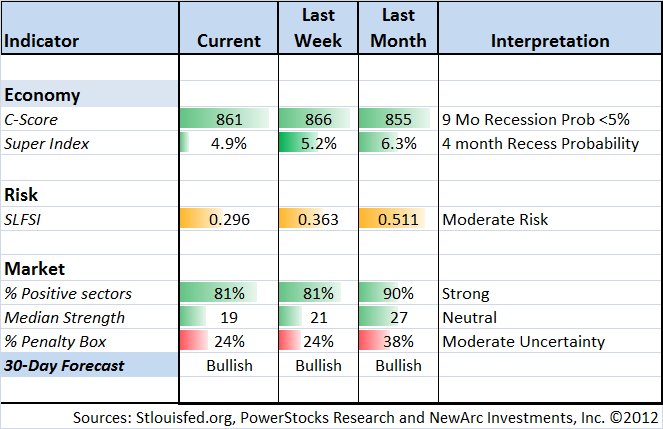
Please check the indicator snapshot below to see why I think the ECRI is wrong on this call, even though they keep moving out the time horizon.
Gas Prices
The discussion of higher gas prices is especially interesting. It is a good illustration of two themes that present a continuing challenge to those of us interpreting the data:
- Cause and effect. Higher fuel prices have resulted, at least partially, from improved prospects for the global economy. Despite this, whenever prices move higher, the pundits suggest that this implies imminent economic collapse. It is pretty easy to see the worst of it no matter what happens -- or maybe the best. What is cause and what is effect?
- The political debate. We had better get used to it. The GOP candidates are on a mission to find something to complain about, just as the Democrats did in 2004 and 2008. As investors, we need to separate the political rhetoric from the investment reality.
This is a real threat, but exaggerated by the media. It is worth watching, with a closer look at economic effects.
The Silver Bullet
I have occasionally recognized leadership in data analysis. We need more of it, and more recognition of those who do it. When you embark on such a story, you are like the Lone Ranger. In the spirit of encouraging this type of work I hope to mention a "silver bullet" story as often as possible. I invite readers to send suggestions.
This week's award goes to repeat winner Joe Weisenthal and the Barclay economics team led by Dean Maki. The ongoing debate over the unemployment rate has sharp political overtones. I understand why Republicans want to make things seem worse and Democrats want it all to look better. I encourage investors to ignore the partisan arguments, often echoed by market pundits of affiliated persuasions, and simply look at the data.
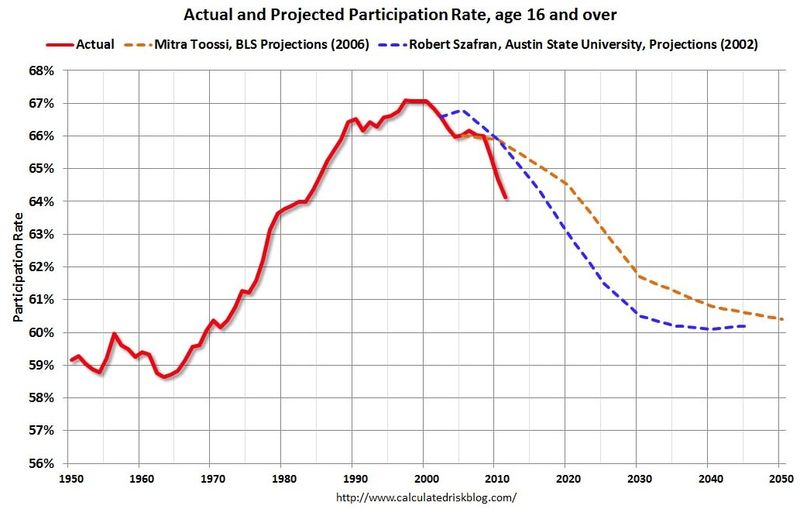
As you can see, the decline in workforce participation was never in doubt, so if you're trying to calculate the "real" unemployment rate simply by holding the participation rate fixed from some point in time, you've already erred.
All of this is a long way of getting to the fact that Barclays economists Dean Maki, Troy Davig, and Peter Newland have a brand new paper called Dispelling An Urban Legend, which blasts the idea that labor force participation is mostly being dragged down by depressed workforce exiles. Instead it's really mostly about the demographics.
Specifically, they write:
Consistent with our view, only a third of the drop in the labor force participation rate is accounted for by those who say they want a job, and only about 15% by those who want a job and are also of prime working age (ie, 25-54). Thus, we view the possibility of a large and sudden return of previously discouraged job seekers to the labor force as remote.
Why are Maki, Davig, and Newland so confident that this is really a demographic story?
This subject is central to the interpretation of the employment story. I strongly encourage readers to take a few minutes to get this important background.
The Indicator Snapshot
It is important to keep the current news in perspective. My weekly snapshot includes the most important summary indicators:
- The St. Louis Financial Stress Index.
- The key measures from our "Felix" ETF model.
- An updated analysis of recession probability.
The SLFSI reports with a one-week lag. This means that the reported values do not include last week's market action. The SLFSI has moved a lot lower, and is now out of the trigger range of my pre-determined risk alarm. This is an excellent tool for managing risk objectively, and it has suggested the need for more caution. Before implementing this indicator our team did extensive research, discovering a "warning range" that deserves respect. We identified a reading of 1.1 or higher as a place to consider reducing positions.
This week continues two new measures for our table. The C-Score is a weekly interpretation of the best recession indicator I found, Bob Dieli's "aggregate spread." I'll explain the link to the C-Score in a future article. The second is the Super Index. You can read more about it in this article, which is merely an introduction, and also my WTWA from a few weeks ago. It reflects extensive research and testing, and is well worth monitoring. (The Super Index includes the ECRI approach). I am going to do a complete review of the work very soon. Meanwhile, I think it is important enough to watch every week.
The team working on recession forecasting and the SuperIndex continues to produce work that is absolutely first-rate. They are generating a suite of measures with differing time frames. For the investment world the key question is how much notice do we need? Here is a great answer:
Assume an investor is following a business cycle expansion buy-and-hold strategy, where the aim is to remain vested in the stock market for as long as possible before the onset of recession. Any defensive action longer than 4.8 months on average before a recession is going to be counterproductive for him or her. Think about this – in the 4.5 months since ECRI's recession call the stock market has rallied more than 22%. Is that counterproductive enough for you?
Here is the snapshot for last week.
Our "Felix" model is the basis for our "official" vote in the weekly Ticker Sense Blogger Sentiment Poll. We have a long public record for these positions. We voted "Bullish" again this week, continuing a long and accurate streak.
[For more on the penalty box see this article. For more on the system ratings, you can write to etf at newarc dot com for our free report package or to be added to the (free) weekly ETF email list. You can also write personally to me with questions or comments, and I'll do my best to answer.]
The Week Ahead
The key economic story this week is employment. We have the ADP private employment report on Wednesday, Initial claims on Thursday, and the monthly employment situation report on Friday. Everything else is a sideshow.
Tuesday has the big election results in the GOP "Super Tuesday" primaries. Everyone is still trying to figure out how to interpret either the GOP race or the general election.
The European crisis has diminished as a daily concern, but the geo-political news as related to oil prices has taken center stage. There is an exaggerated focus on the Greek debt swap. We'll have the answer on that about an hour before the market close on Thursday.
For my accounts I am watching energy prices closely. I'll do my regular employment preview later this week.
For those with a short-term trading perspective, I monitor news and economic data every day in my diary at Wall Street All Stars (subscription required, but I have some membership discounts available for my readers).
Trading Time Frame
Our trading accounts have been 100% invested since December. Felix caught the current rally quite well, buying in on December 19th. There are now many solid sectors in the buy range.The overall ratings have improved, helping us to stay invested while many have been in denial for the entire rally. This program has a three-week time horizon for initial purchases, but we run the model every day and change positions when indicated. Felix has been more confident than I have been on the trading time frame. This illustrates the importance of watching objective indicators instead of headlines.
Investor Time Frame
Long-term investors should be aware of the rapid decline in the SLFSI. Even for those of us who see many attractive stocks, it is important to pay attention to risk. In early October we reduced position sizes because of the elevated SLFSI. The index has now pulled back out of our "trigger range," and is declining further. This sort of decline has been a good time to buy stocks on past occasions.
Even though stock prices are higher than in October, the risks are much lower. I have been increasing position size for risk-adjusted accounts. (We cut back by about 30%). I am also looking more aggressively for positions in new accounts.
Our Dynamic Asset Allocation model is still pretty conservative, but starting to change into equities. For several weeks I have joked that it is rather like the Nouriel Roubini of our methods.Dr. Roubini is now becoming more bullish. There is nothing wrong with this! There are many successful market strategies. The risk/reward balance is a personal matter.
To summarize, over the last month we have become much less conservative in all of our programs. There is still risk, but as our indicators become more positive, we can and should become more aggressive. For new accounts we are establishing immediate partial positions, using volatility to buy favored names and selling calls for those in the Enhanced Yield program. This program continues to work very well, meeting the objectives of conservative, yield-oriented investors. It follows our key precept:
Take what the market is giving you.
I have been repeating this each week, because it is by far the most important message. It is better than trying to time the market. You can buy great dividend stocks at reasonable prices with the chance to sell call options at inflated prices. If the stocks do nothing, you can still get almost 10% per year from dividends and call premiums.
This does not work for those selling long-dated calls. It requires some active management, selling calls with a month or two before expiration to capture the most rapid time decay.
The Final Word
The biggest challenge for most traders and investors is adopting and following a disciplined method. Whatever your choice, you need to keep this in mind:
Your system will not always work!
It is easy to coast along when all is well. You must be able to act when things seem threatening. Many investors have been completely wrong on their market read. When there is an unsurprising dip, they see it as confirmation rather than opportunity.
I have been using the last two days to establish good positions in great stocks for new clients. For every new client we do not go "all in " on day one, but try to find good entry points.
I am also using the opportunity for our enhanced yield program. When stock prices move lower and option premium moves higher, it is a great time to do covered writes. There are many good dividend stocks that fit the program.
