These charts help us understand that a top is not just price, but a reversal in extremes of margin debt, valuation and sentiment.
In blow-off tops, extremes of valuation, complacency and margin debt can always shoot beyond previous extremes to new extremes. This is why guessing when the blow-off top implodes is so hazardous: extreme can always get more extreme.
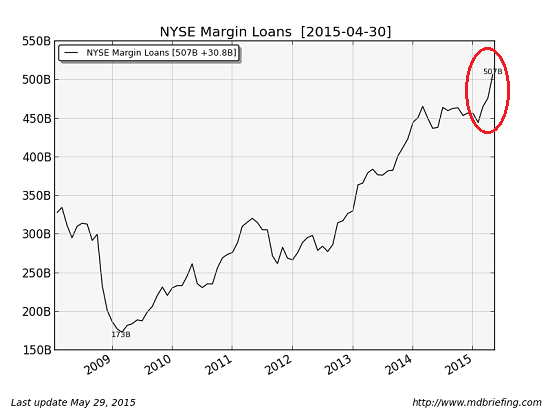
Nonetheless, extremes eventually reverse, and generally in rough symmetry with their explosive rise. Exhibit 1 is margin debt: NYSE Margin Debt Hits a New Record High (Doug Short). Note the explosive rise in margin debt in the past few months: 
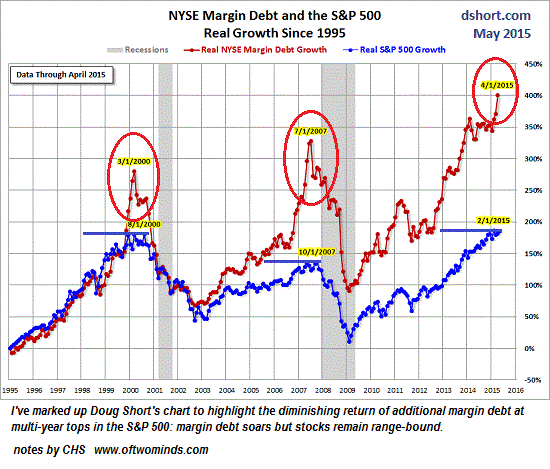
At tops, soaring margin debt no longer pushes stocks higher. I've marked up an excellent chart by Doug Short to highlight the diminishing returns of more margin debt at tops.
It's clear this same dynamic of diminishing returns is in play now, as margin debt has skyrocketed while the S&P 500 has remained range-bound, with each new high being increasingly marginal.
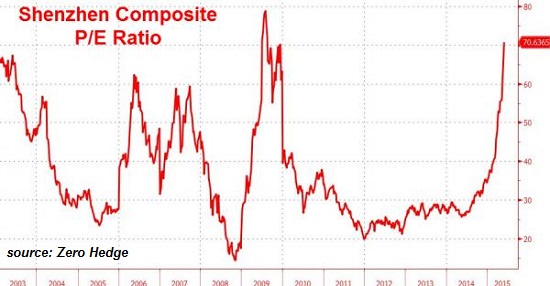
Exhibit 2 is China's Shenzhen stock exchange. The price-earnings ratio (P/E) is a useful gauge of sentiment: when sentiment reaches extremes of euphoria, PEs go through the roof:
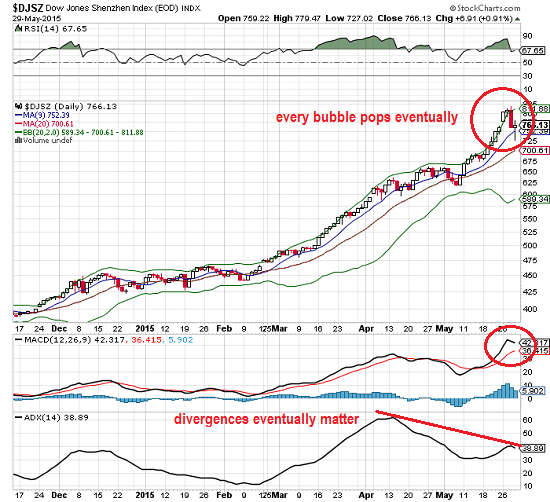
It appears that the Shenzhen bubble has burst. Latecomers to the bubble party will continue to buy the dips, but the ADX (a measure of trend strength) has been diverging for quite some time, and the MACD is rolling over into a sell signal.
These charts help us understand that a top is not just price, but a reversal in extremes of margin debt, valuation and sentiment. Many observers have an unyielding faith that central banks will never let markets decline ever again. There are four flaws in this blind faith:
1. Central banks did not want bubble markets in 2000 and 2008 to burst, either, but the bubbles popped despite central bank interventions.
2. Extremes can only get more extreme for a limited time. Margin debt cannot rise from $507 billion to $5 trillion and then on to $50 trillion (three times the size of the U.S. GDP). The Shenzhen P/E ratio cannot rise from 70 to 700.
3. Complex systems cannot be beaten into submission by two simple sticks (central bank liquidity and zero interest rates) forever. Extremes give rise to dislocations that cannot be beaten into submission by central banks for this reason: it is the nature of complex systems to break at the very points that cannot be strengthened or defended by simplistic manipulation.
4. When the speculative frenzy dissipates, central banks will be the only buyers left. Unless the Fed increases its balance sheet from $4.5 trillion to $14.5 trillion in a matter of months, even central bank manipulation will be swamped by sellers exiting bursting-bubble markets.
