Yesterday’s Fed announcement was yet more of the same -- ‘We think the economy is fine, there’s no need to lose faith in us, but in case you do then we promise to keep printing money.’
It was such a non-event of a statement that the markets did literally nothing. We can see so here, courtesy of Zerohedge:
- Pre: 10Y 1.94%, ES 1550, Gold $1606, WTI $92.70, EUR 1.2950
- Post: 10Y 1.935%, ES 1551.5, Gold $1606.5, WTI $92.95, EUR 1.2966
Since the beginning of the year, and really since gold hit $1,900 in 2011, we’ve all had to listen to why gold is over. Why the bull-market is done and what a bitter pill those of us who thought buying gold was a good idea, will now have to swallow.
But when you see announcements such as that from last night, (not to mention Cyprus) you realise where gold is off to -- and it isn’t retreating.
Great News For Gold
The Fed’s reassurance that they’ll keep pumping money into the economy is great news for gold. But even without it, we’ve got a long way for gold to go before we have to start worrying.
Many of you will have likely seen by now our new gold price calculator section. My favourite in there is the ‘Gold versus debts’ calculator which values gold against the U.S.’s external debts.
Our calculations are based on Jim Sinclair’s belief that ‘Gold’s job is, and will always attempt to during periods of monetary stress, balance the INTERNATIONAL Balance Sheet of the USA.’
The amount of U.S. debt held by foreign creditors is huge; yet the trust which is held in the U.S. dollar reserve system is unsustainable. We already see the Chinese slowing down and reducing their holdings of U.S. Treasuries, whilst countries such as Russia and India are working around trading in dollars.
In order to become a solvent and trusted economy once again the U.S. need to buy back those dollars held by foreign and international investors. This debt currently stands at over $5,555 billion. Sinclair believes, they can do this by offering their gold reserves to creditors in payment for the debt.
However, gold at the current price is not enough to cover this mammoth debt. The U.S. reportedly holds 261,496,811.4 ounces as part of their reserves, just over 8133 tonnes. At today’s price this is ‘only’ worth $420 billion.
So where would gold have to get to in order to balance the U.S.’s international balance sheet?
This thinking is based on Sinclair's formula:
- Oz’s of Gold Held by U.S. x $ Price of Gold = External Debt
We can work this back to find out where the gold price needs to be in order to balance the external debt of the U.S. This gives us a gold price of $21,244. The ‘Sinclair gold price’ can be seen in the graph below.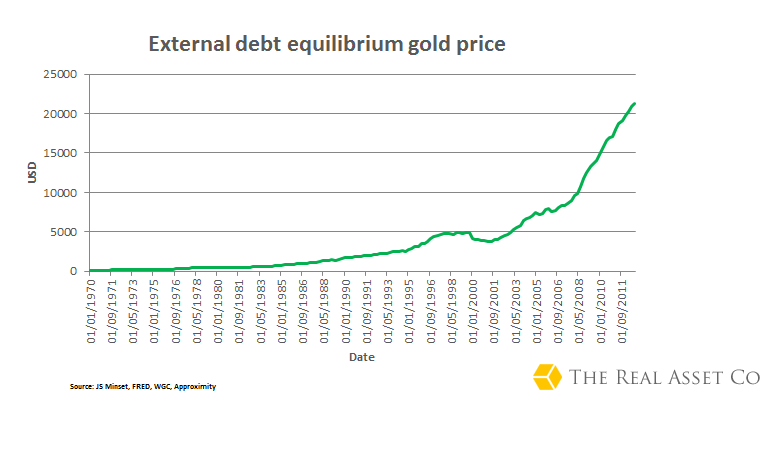
And they say the gold bull-run has come to an end. The two graphs below illustrate the key components of Sinclair’s equation.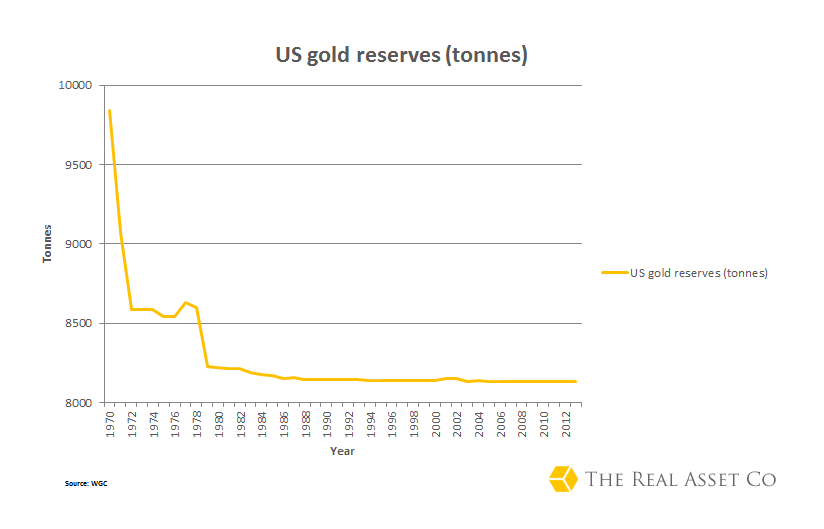

The U.S.’s debts have been increasing, whilst the U.S.’s gold reserves have been decreasing. This pushes up the gold price needed in order to balance with the U.S.’s external debt.
Sinclair is famed for unloading his entire gold position on January 21 1980, citing his model and inflation fighting efforts from Paul Volcker in the U.S., as reasons for doing so. This move netted him $15 million dollars. Following the sale he predicted the gold price would do very little over the next decade or so.
The graph below shows the ratio between Sinclair’s gold price (External debt equilibrium price) and the gold price.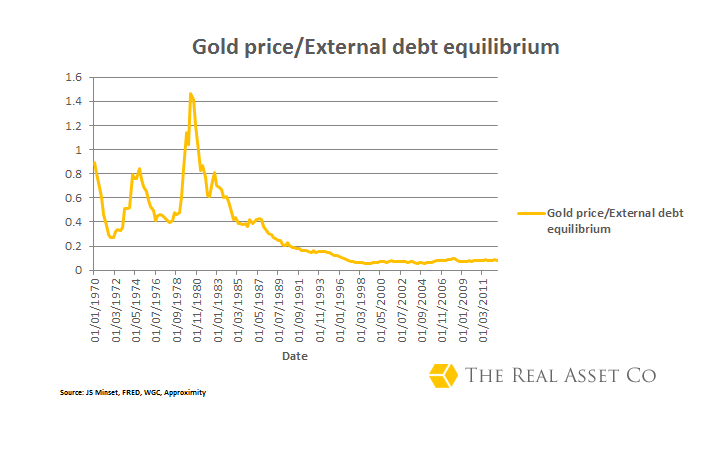
We can see that at the time Sinclair first sold, In January 1980, the ratio was above 1.5. Now, it’s 19 times lower, it’s little wonder that Mr Sinclair thinks we should keep hanging on to gold for some time to come.
It has been pointed out in the past that had Sinclair followed his own model to the book then, he would have sold at the much lower price of around $450 an ounce -- instead he sold at $900 an ounce. Sensibly he wasn’t just looking at this model but also the macro-factors surrounding it. Such as the inflation situation in the U.S. and what mining companies were doing.
With this in mind, we are now in a better position to use Mr Sinclair’s gold equilibrium model than ever before. Not only have we seen it in action in the past but we have also seen the market price either match up to or outperform the model price.
Further Evidence Of Gold’s Price Rise
We also have, unlike Mr Sinclair in the 1970s, over 40 odd years of seeing central banks abuse the fiat system given to them. We have watched how governments and bankers print their money, time and time again, repeatedly falling flat on their faces. We also have the added benefit of watching a whole new generation of investors turn to gold investment, despite never having lived through the gold-exchange standard or any economically hard times.
Sinclair’s is one of many models we could use in order to predict the gold price. Here at The Real Asset Company we’re not all that into predicting anything, after all it’s what the government does and look at how wrong they get it. But, Sinclair’s predictions are very much based on history and common sense.
And of course, we can’t mention the U.S.’s gold reserves without mentioning the issue of what gold still exists. Despite recent audits, nothing concrete has been shown in many years of what gold is still held by the U.S. Dr Ron Paul’s biggest battle was to have an independent audit carried out, but to little avail. Many believe that through a series of swaps and leasing arrangements, there is in fact very little gold left in the U.S.’s vaults.
If this is the case, imagine the highs gold will have to get to in order for the U.S. to become solvent once again.
Why not take look and have a play with our other gold price calculators? Here we show different way in which you can predict the gold price -- why not look at the price of gold compared to other bull markets? Or, very topical at the moment, the price of gold next to the money supply.
Please Note: Information published here is provided to aid your thinking and investment decisions, not lead them. You should independently decide the best place for your money, and any investment decision you make is done so at your own risk. Data included here within may already be out of date.
This post How much further can gold go? was published by The Real Asset Company.