As a general rule, the most successful man in life is the man who has the best information
The global economy is booming again after years in the doldrums, commodities are back in a big way, and metals prices are for the most part, way up.
In our last article showing how commodities are the place to be in 2018, we looked at five drivers: inflation, the low dollar, economic growth, the relative undervalue of commodities versus other sectors, and tightness of supply. This article expands on the economic growth argument, and explains how commodity prices are being moved by a bevy of infrastructure projects around the world – all demanding “yuge”, as Donald Trump would say, amounts of metals.
But we'll also talk about how insecurity of supply has created a climate of uncertainty around commodities, fuelled by increasing trade tensions that could lead to tariffs and quotas, driving up the prices of some imported metals– further exacerbating supply-demand imbalances. The US is finally starting to get that it must reduce its reliance on foreign metal suppliers, which is great for domestic exploration and mining. But first, let's talk about global growth and what it means for commodities.
Three quarters of the world is growing
A year ago the global economy was stagnant following the recession of 2007-09, an overhang from the debt crisis in Europe, and slowing Chinese growth which had seen double-digit GDP numbers throughout the 2000s. According to the International Monetary Fund, 75% of the world is now enjoying a full recovery. The IMF predicts global growth to hit 3.7% this year, the fastest rate since 2010.
The World Bank says it’s the first year since the financial crisis that the global economy will operate at or near capacity. Emerging markets will see the lion’s share of growth, 4.5%, while advanced economies including the US, Japan and the EU will grow at 2.2%. China is expected to grow between 6 and 7%. India, Ghana, Ethiopia and the Philippines will grow more than China, and eight of the 10 fastest-growing countries this year are likely to be in Africa, according to consulting firm PwC.
Goldman Sachs was quoted saying that “rising commodity prices will create a virtuous circle, improving the balance sheets of producers and lenders, and expanding credit in emerging markets that will, in turn, reinforce global economic growth.”
At the end of 2017 the Bloomberg Commodity Index, which measures returns on 22 raw materials, had the longest rally on record dating back 27 years to 1991.

The index was propelled by major yearly gains in copper, which had its best month in 30 years in December, oil, which moved above $60 a barrel for the first time in over two years, and gold, up for the second year in a row, by 12.5% in 2017. The roll continued into the New Year, with the index hitting a three-year high on Jan. 5 due to what the Financial Times described as the global economy’s best period of growth (measured in manufacturing activity) since the 2008 financial crisis.
At this year's World Economic Forum in Davos, Switzerland, the tone was vastly different from the past two years when everyone was talking about the bear market for commodities and the oil price crash.
“In panel discussions, interviews, and conversations on the evening cocktail circuit at the Steigenberger Grandhotel Belvedere, it was hard to find a bearish voice,” Bloomberg reported.
Key infrastructure metals all rising
Building large, capital-intensive public and private infrastructure projects all requires mined metals, in particular steel for bridges and buildings, aluminum, copper for wiring, and inputs used for making steel: coking coal, iron ore, manganese and vanadium. Nickel is also used in large quantities for stainless steel.
The outlook in 2018 for these commodities is for the most part bullish. A report from the World Bank states that a correction in iron ore prices – due primarily to a supply glut – will be offset by jumps in other base metals including lead, nickel and zinc.
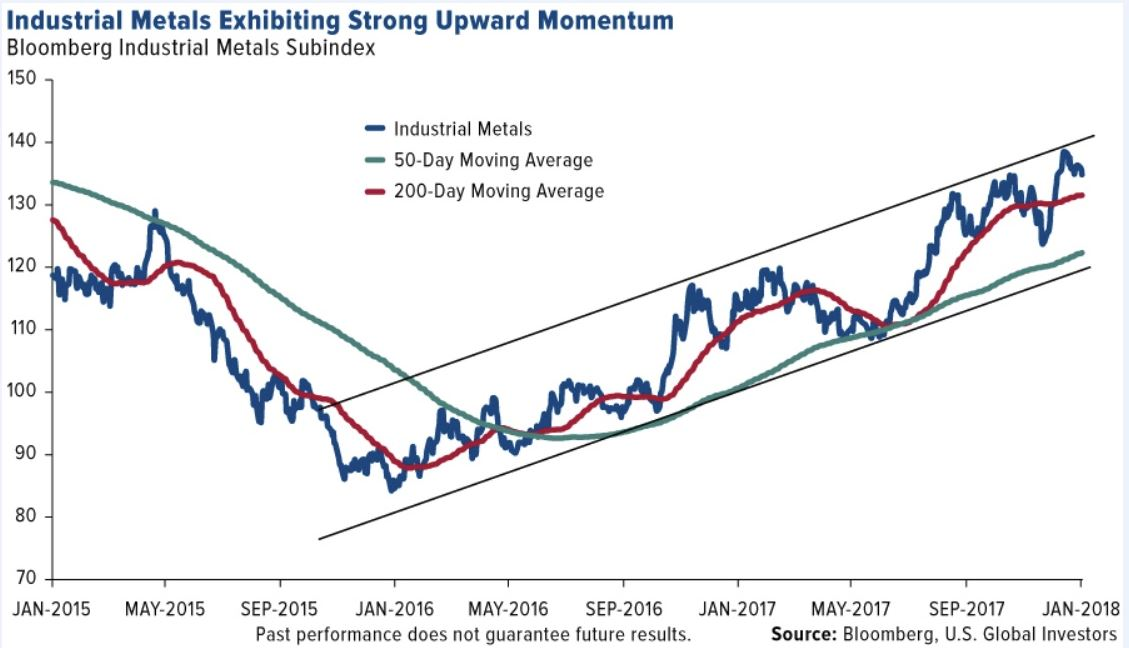
A week ago mining stocks outperformed overall gains in US stock markets following the Feb. 5 correction, with investors piling into mining heavyweights like BHP Billiton (LON:BLT) Ltd ADR (NYSE:BHP), VALE SA (NYSE:VALE), and Anglo American (LON:AAL). The optimism was spurred by global demand for raw materials ahead of the annual Chinese New Year holiday. Copper rose above $3.24 a pound, nickel was at 14,100 a tonne, the highest since May 2015, and zinc hit a near-decade high of $3,567 a tonne. Even the iron ore price which many expect to pull back, rose to a five-week best of $78.25 a tonne.
Speaking recently with Robert Friedland of Ivanhoe Mines, US Global Investors CEO Frank Holmes laid out the bullish case for copper, noting the ever-increasing demand for the red metal not only in industry, but electrical vehicles which consume three to four times as much copper as gas-powered cars and trucks.
Friedland pointed to aluminum, cobalt, nickel, platinum and scandium as among the biggest beneficiaries in the shift to EVs and clean energy. Holmes mentioned a few other key trends that are driving commodities higher, including the global purchasing managers index (PMI) being near a seven-year high, construction confidence in the Euro Zone, and construction spending in the US which hit a record $1.257 trillion in November.
As usual a crucial factor is China, the world's largest consumer and producer of metals. On Feb. 8 China's copper concentrate imports increased 25% from the same period last year, continuing the trend from 2017 when copper imports hit a new high due partly due to Beijing banning of scrap metal and other recyclables.
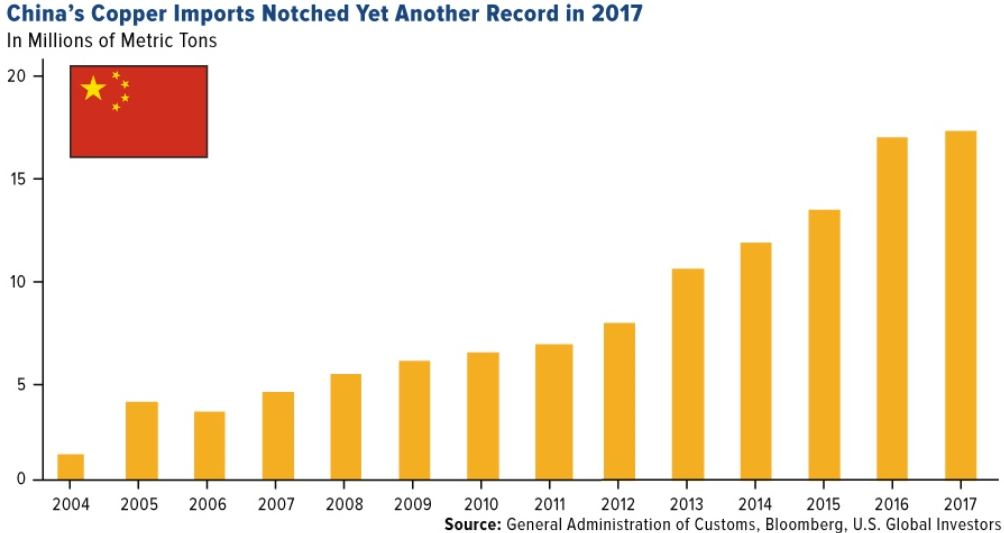
The Chinese have also been importing record amounts of iron ore – 102.8 million tonnes in September 2017. China wants higher-grade ore because it boosts steel-making productivity and reduces emissions.
China's iron ore imports rose in January even as steel mills are idled as part of a government drive against pollution and stockpiles at ports reached new peaks above 150 million tonnes. The country consumes two thirds of the world's iron ore shipments and produces as much steel as the rest of the world combined.
And for all the talk of the coal industry being on its knees, prices of the fossil fuel are up and so are US coal exports. Platts reported that in 2017, US coal exports rose by 60% between 2016 and 2017, to 88 million tonnes. Thermal coal prices in 2017 were the highest in Northern Europe since 2012 - $84.77 a tonnes, while met-coal prices used in steelmaking averaged $173.95/tonne, up 39% from 2016.
New commodities super cycle?
Many investors are wondering whether we've begun a new commodities super cycle.
“Purchasing Managers’ Index™ (PMI™) surveys have been developed in many countries to provide purchasing professionals, business decision-makers and economic analysts with an accurate and timely set of data to help better understand industry conditions. PMI data are based on monthly surveys of carefully selected companies. These provide an advance indication of what is really happening in the private sector economy by tracking variables such as output, new orders, stock levels, employment and prices across the manufacturing, construction, retail and service sectors. The PMI surveys are based on fact (latest PMI’s from Markit Economics), not opinion, and are among the first indicators of economic conditions published each month. The data are collected using identical methods in all countries so that international comparisons may be made.”Markit Economics.
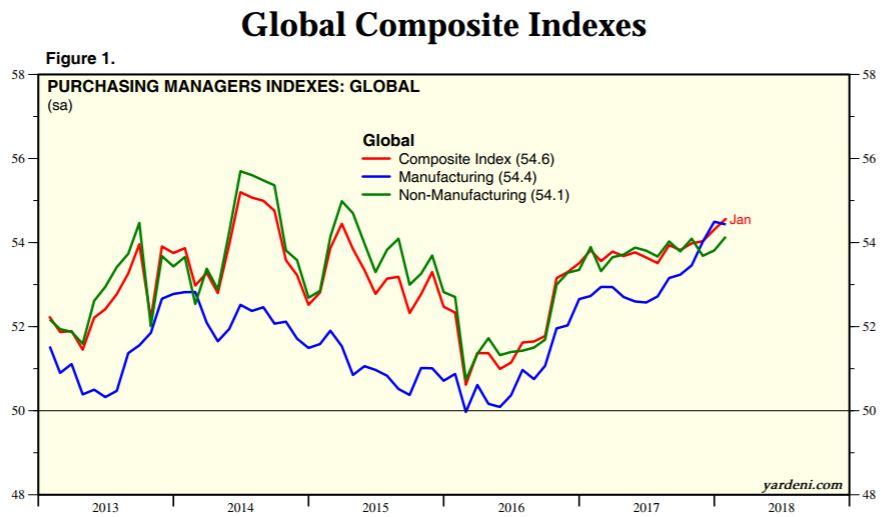
Here is a link to more global PMI charts from Yardini Research.
“Super cycles are extended periods of historically high global growth, lasting a generation or more, driven by increasing trade, high rates of investment, urbanisation and technological innovation, characterised by the emergence of large, new economies, first seen in high catch-up growth rates across the emerging world”~ Helmut Reisen shiftingwealthblogspot.com
As mentioned, Goldman Sachs, the influential investment bank, thinks that rising commodities prices will expand credit in emerging markets, thus creating more economic growth. Back in 2011 I wrote about how developing economies will boost the commodities supercycle, with the drivers in these countries being population growth, urbanization and the growth of the middle class, all of which spur consumption – of cars, fridges, smart phones, etc. These minerals have to come from somewhere.
In Daily Reckoning Australia, Callum Newman observes that there is some serious money right now sloshing around waiting to find a home. Examples include Saudi Arabia's Crown Prince wanting to spend US$500 billion to build a new city, and Australia's $130 billion Future Fund. Callum presages a new mining boom in Australia by pointing out that between 2010 and 2025 infrastructure spending in Asia will hit US$5.3 trillion, with China's total spend increasing 250% and for the Philippines, 300%. All of this bodes well for Australia, a major exporter of iron ore and coal, used to make steel needed for bridges, roads and airports, plus gold and other minerals.
Maxwell Gold, director of investment strategy and research at ETF Securities, agrees that we are on the cusp of a new commodities super cycle, which he points out usually last 10 to 15 years.
Gold says we are currently at the last phase of the current business cycle (lasting 5 to 7 years) where commodities tend to outperform stocks.
“The Fed and other central banks want to increase interest rates to slow down and control economic growth to prevent the economy from overheating too much. That typically goes hand in hand with a period where there's increased demand for inputs, raw materials and resources ― primarily commodities. It's very typical to see commodity prices increase when we’re in a rate-hiking cycle and interest rates are rising.”
Infrastructure engine revving up
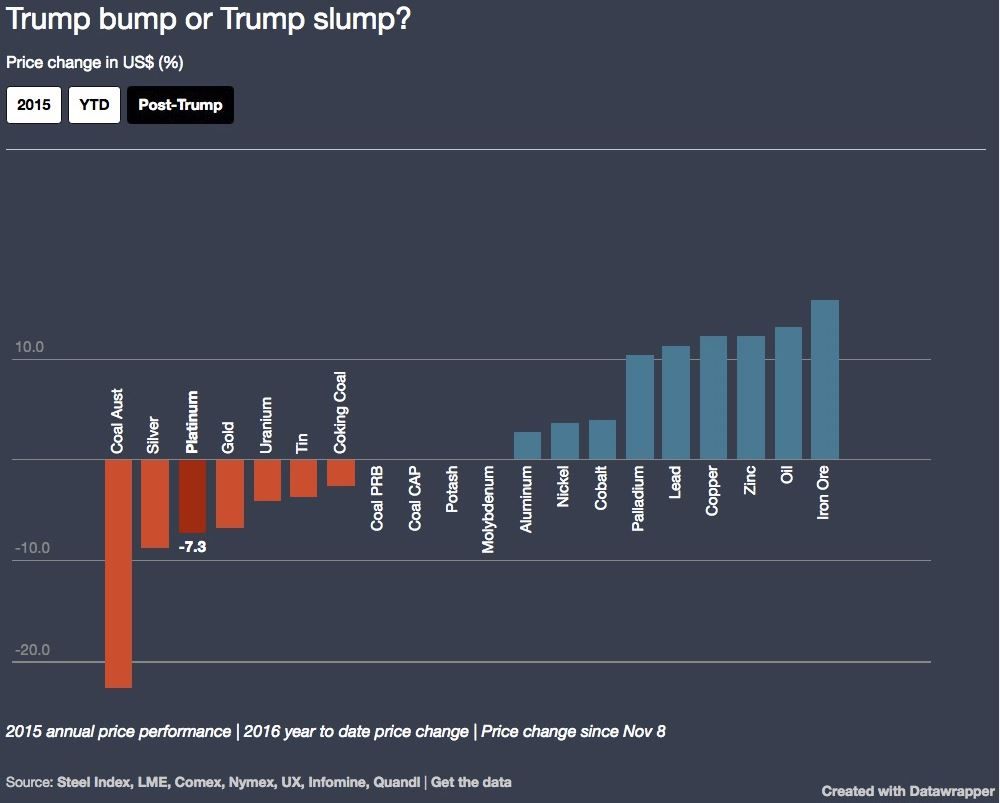
Most of us have heard of Donald Trump's $1-trillion infrastructure plan to fix American's crumbling cities, touted during his 2016 election campaign. A year into his mandate, that spending has been elevated to $1.7 trillion over the next decade. When or whether it comes to fruition is still fuzzy – the plan being presented to Congress involves $200 billion in federal funds, an amount being disputed by Democrats, and could involve a gas tax to pay for it – what is interesting is what happened to commodities after Trump was elected. A month after the election was decided on November 8, 2016, oil and most base metals received a “Trump bump”, as shown in the graph below by MINING.com – proving that the promise of infrastructure spending has a direct impact on commodity prices – albeit in the short-term.
The effect of the US infrastructure plan on metals prices in 2018 is difficult to say, but one thing is for sure: the need is desperate. A 2017 report from the American Society of Civil Engineers gave America's infrastructure a D+ and found that the US is facing $4.6 trillion in infrastructure investment needs over the next 10 years. The report looked at 16 categories including bridges, schools, railways and ports.
“Deteriorating infrastructure is impeding our ability to compete in the thriving global economy, and improvements are necessary to ensure our country is built for the future,” according to the ASCE. Consulting firm PwC estimated in a comprehensive infrastructure report that the US is looking at a total funding gap between 2016 and 2025 of $1.4 trillion, with the vast majority of funds needed for surface transportation ($1.1 trillion funding gap).
North of the 49th, Canada also plans to roll out a major infrastructure spend, though far less ambitious than the one planned in the US. The federal government's $5.4 billion infrastructure package in transit and water systems for provinces and cities was recently extended from two to five years. Ottawa and the Yukon Territory are partners in a promise to spend $360 million for road access to mineralized areas in the Yukon, including 650 kilometers of new roads and road upgrades.
The Quebec government has called for the province to invest about $1.3 billion in infrastructure over the next five years to attract $22 billion in private sector investment. The scaled-down “Plan Nord” aims to access untapped deposits of iron ore, copper, nickel, zinc and other minerals in Quebec's far north. Next door in Ontario, the provincial government is moving forward on an all-season road to the Ring of Fire, allowing roads in to a wealth of minerals in the remote region including chromite, nickel, copper, vanadium, zinc, platinum and gold.
Looking globally, Futurism put together a graphic of the world's largest megaprojects currently under construction. They are:
- the International Space Station: $150 billion
- Al Maktoum International Airport, Dubai: $82 billion
- South to North Water Transfer Project, China: $78 billion
- California High-Speed Rail: $70 billion
- Dubailand: $64 billion
- London Crossrail Project: $23 billion
- Beijing Daxing International Airport: $13 billion
- Jubail II, Saudi Arabia: $11 billion
- Hong Kong-Zhuhai-Macao Bridge: $10.6 billion
In terms of commodities demand, though, the most impactful country is, without a doubt, China.
“More than 2,000 years ago, China’s imperial envoy Zhang Qian helped to establish the Silk Road, a network of trade routes that linked China to Central Asia and the Arab world. The name came from one of China’s most important exports - silk. And the road itself influenced the development of the entire region for hundreds of years.
In 2013, China’s president, Xi Jinping, proposed establishing a modern equivalent, creating a network of railways, roads, pipelines, and utility grids that would link China and Central Asia, West Asia, and parts of South Asia.” McKinsey & Company.
China’s One Belt, One Road is a $900 billion initiative meant to open channels between China and its neighbors, mostly through infrastructure investments. China long ago put a lock on much of Africa’s vast resources. The rationale is to increase trade in order to bolster poorer countries to China's south, and foster new markets that will keep China's economy going strong. According to the World Economic Forum, "Beijing says it will ultimately lend as much as $8 trillion for infrastructure in 68 countries," which represents a third of global GDP.
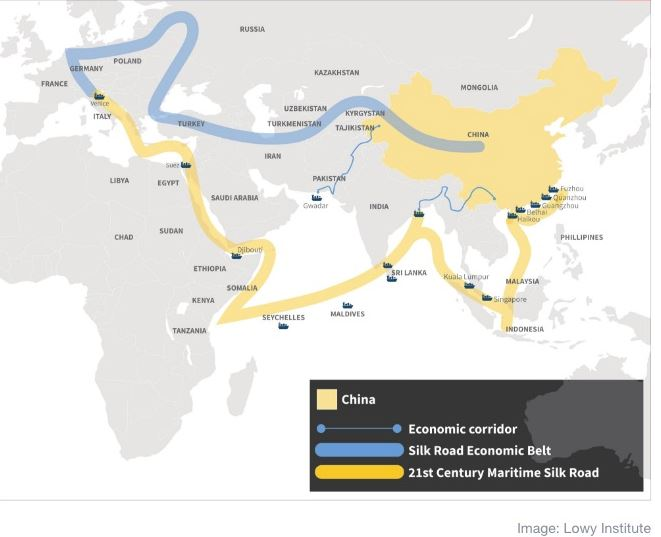
And there's more. Last April President Xi Jinping announced a grand scheme to transform a backwater called Xiongan, south of Beijing, into a city triple the size of New York. Consulting firm Wood Mackenzie estimates that building the city will use 20 million tonnes of steel, 400,000 tonnes of aluminum, and 250,000 tonnes of copper during the first 10 years of construction.
Are two Belt and Roads better than one? Australia, the US, India and Japan are planning a joint regional infrastructure scheme as an alternative to China’s multibillion-dollar Belt and Road Initiative.
Supply insecurity
Completing all of these infrastructure projects will require millions, maybe billions of tonnes of iron ore, coal, steel, copper, vanadium, cement and asphalt. But what is often lost in the discussion about commodities is where these materials will come from and whether the countries requiring them will be able to get their hands on the metals in time and in the quantities needed. I've written before on the metallurgical Achilles heel of the United States, which has allowed the depletion of four critical metals: chromium, cobalt, manganese and platinum. Added to this list should be vanadium, which is becoming increasingly important as an ingredient (vanadium pentoxide) in vanadium flow batteries used in renewable energy storage.
The U.S. is dependent on South Africa, the politically unstable Democratic Republic of Congo (DRC) and an increasingly unreliable and aggressive China for over half of its supply of what it considers strategic or critical minerals.
“As resource constraints tighten globally, countries that depend heavily on ecological services from other nations may find that their resource supply becomes insecure and unreliable. This has economic implications – in particular for countries that depend upon large amounts of ecological assets to power their key industries or to support their consumption patterns and lifestyles.” Dr. Mathis Wackernagel, President of the Global Footprint Network
The United States has no producing manganese or vanadium mines. Stillwater Mining is the only American miner of platinum group metals, and there is just one company in Michigan that produced cobalt in 2017 as a by-product of nickel and copper.
Cobalt is an interesting metal to look at because it demonstrates the stark and growing disparity between supply and demand, reflected in a massive recent price spike. Over the past year cobalt prices have nearly doubled from US$47,500 a tonne to $80,000/tonne.
As a key ingredient in lithium-ion batteries that power electric vehicles (cobalt is used in both nickel-cobalt aluminum (NCA)-based battery cells used by Tesla (NASDAQ:TSLA) and nickel-manganese cobalt (NMC) batteries employed by other EV manufacturers), cobalt is in high demand by battery makers.
Tesla says it wants to make half a million EVs a year, and has repeatedly stated that it plans to source the cobalt for its Gigafactory exclusively from North America. But the numbers don't add up. According to the US Geological Survey Canada and the US together produce only 4% of the world's cobalt supply – around the amount Tesla would need for just one of its models. In 2017 the US and Canada produced 4,950 tonnes of cobalt against the world total of 110,000 tonnes. How about metal in the ground? North American reserves stand at 273,000 tonnes versus 3.5Mt in the Congo and 1.2Mt in Australia.
But there's another problem with cobalt supply. Around 97% of it is mined as a by-product of copper and nickel, so in order for cobalt mining to be economic, the prices of nickel and copper need to be high enough to make mining the deposits economic. 60% of the world's cobalt reserves and resources are in the DRC, which uses child labour and is highly unstable. One of the largest African copper-cobalt mines is Tenke Fungurume, in the DRC. US copper miner Freeport MacMoran used to hold 56% of the mine, with Lundin Mining and Congolese state-owner miner Gecamines owning the rest, but in 2016 China Molybdenum acquired Freeport's portion for $2.65 billion – the largest ever investment in the country.
